Categories
Article Library

An Executive Summary of the 2006 Marketing ROI and Measurements Trend Study (Marketing Profs)

Lenskold Article Series

by Jim Lenskold

An Executive Summary of the 2006 Marketing ROI and Measurements Trend Study (Marketing Profs)

The buzz about marketing profitability measurement in previous years is certainly turning to action in 2006. At this point, companies not pursuing some form of financial measurements are in the minority. There are still 4 in 10 companies that consider themselves “a long way from where they should be” in terms of their ability to measure financial returns and another 4 in 10 that are “somewhat short of where they could be,” so the industry is in the early stages of the marketing profitability measurement journey.


Our objective of this study was to take the pulse of the industry. The original study in 2005 showed signs of life and now we see a strengthening heartbeat. The progress overall is inspiring and certainly demonstrates an evolution within the marketing practice.


The key findings can be summarized as:


  1. Capabilities to measure marketing’s impact on financial returns increases significantly since 2005.
    Marketers that describe their capability to measure financial returns of marketing as “a real source of leadership” or “as good as they need to be” increased from combined totals of 8% in 2005 to just over 16% in 2006. This was matched with a significant drop in the percentage of marketers describing their capability as “a long way from what it should be” (a decrease from 53% to 42%).

  2. Providing budget for marketing measurement and analytics showed slight improvement but continues to be a problem.
    Only 17% of marketers indicate their budget for marketing measurements and analytics is just right. Two out of three (64%) indicate this is slightly or far below the right level. Just 8% believe it is slightly or far above the right level. While it is discouraging to see a gap in the right amount of funding for an investment that can unlock significant profit potential, the glimmer of hope is the improvement over 2005, where 78% had indicated being under-funded.

  3. CEOs and CFOs have increased confidence that marketing investments are profitable, according to marketers surveyed.
    The percentage of marketers indicating their CEOs and CFOs are somewhat or very confident that marketing investments are profitable increased from 62% to 71% over the past year. Of the companies reporting they measure marketing profitability, 31% report that their CEO and CFO are very confident compared to 16% of those that do not measure marketing profitability.

  4. The ability to link brand measures to incremental sales and profits has increased over the past year.
    Marketers reporting their ability to make this brand measure link as “a real source of leadership” or “as good as it needs to be” increased from a combined total of 6% in 2005 to 15% in 2006. Those who considered their position as “a long way from where it should be” dropped from over two-thirds (65%) in 2005 to 42% in 2006.

  5. Marketing organizations that calculate ROI, net present value or other profitability metrics to assess marketing effectiveness report high CEO and CFO confidence and a high perception of accountability.
    There were 26% of the marketers surveyed that indicated their organizations calculate ROI or similar financial metrics for at least some portion of their marketing campaigns. Of this segment, 31% reported that their CEO and CFO were very confident that their marketing investments were profitable while only 16% of the marketers that do not calculate ROI or similar financial metrics indicated a very high level of confidence. In organizations calculating ROI, 28% of non-marketing executives were reported to view marketing as highly accountable, while this was just 15% in organizations not calculating ROI. One reason this group may be better positioned to calculate the ROI of marketing initiatives is that more reported having the right budget level compared to organizations that do not calculate ROI (26% vs. 15%)

  6. The expected profit potential from improved marketing measurement experienced a sharp jump in the “greater than 25%” category.
    When those measuring marketing profitability were asked “If measurements were in place to capture marketing’s contribution to sales, how much profit improvement would you expect?,” the percentage reporting “very high (profit improvements greater than 25%)” increased from 12% in 2005 to 28% in 2006. Another 46% expected increases of 10% to 25% profit improvement. Only 8% believed there was no opportunity for profit improvement.

  7. Those marketing organizations that launch new marketing campaigns using market tests over intuition are even stronger in confidence from the CEO and CFO and are reported to have greater accountability.
    One segment from our analysis that stood out was the set of respondents defined as those marketers that answered the question “Which best describes your organization’s typical approach to launching new marketing campaigns?” with the response “campaigns are first market tested to a small segment of the target audience for a quantitative assessment.” Just 14% selected this response and they showed incredibly high performance on our assessment questions compared to the balance of the participants that selected “campaigns are rushed to market based on the limited intuition of a few people” (38%), “campaigns are assessed against a large team’s intuitive knowledge” (30%) or “campaign creative / concepts are tested in qualitative research” (13%).Even more so than the segment of respondents calculating ROI, this segment of “market-testers” showed stronger results in all different areas including greater effectiveness at measuring financial returns, higher incidence of calculation of financial metrics, higher use of marketing methodologies, greater CEO and CFO confidence and better perceptions of being highly accountable. They were also more likely to indicate their marketing measurement and analytics budget was “just right.” Running market tests as part of new campaign launches is not what drives increased adoption of financial measures or even greater credibility with executives. It is however, a good indicator of a marketing culture that values disciplined measurements, ROI analysis, and financial accountability.

In our opinion, the positive momentum identified in this study is likely to continue. Why? Because corporations need sources of profitable growth and improving measurements helps unlock additional profit potential.


Improvements in data access, analytics, measurements, and financial assessments must continue to be important to move past the noted barriers to measuring marketing profitability. As companies work to make marketing profitability measurement a guide to their growth, they can benefit from the discipline of:

1. Developing better projections of marketing’s financial contribution
2. Creating tighter integration across marketing programs and even with the sales organization
3. Taking a greater role in maximizing customer value
4. Seeking to measure and understand marketing’s impact at a deeper level

Companies that share their marketing ROI success stories at industry events or in articles almost always state that they still have further to go. It’s not because their work is incomplete but because the success they have already achieved makes it clear that additional progress will lead to additional benefits. Look closely at these trends in financial measurements for marketing and, regardless of where you are at on your marketing ROI journey, consider what progress you can make in this and future years.

Access the full report: 2006 Marketing ROI & Measurement Study.

© Lenskold Group Inc. & MarketingProfs, LLC.

Categories
Archived Research

2008 Lead Generation ROI Study

Lenskold Article Series

by Jim Lenskold

2008 Lead Generation ROI Study

This was the first research that branched off to dig into B2B Lead Generation marketing (the general marketing research continued in during this year as well). 


  • Benchmark study for B2B Lead Generation Marketing
  •  

  • What are the most important lead generation objectives to drive high performance?
  •  

  • How is marketing balancing lead quantity vs. lead quality metrics?
  •  

  • How does alignment with the sales organization drive highly effective lead generation marketing performance?

Here is a featured highlight from this study:

Fill Out the form to complete the download


By submitting this form, you are consenting to receive marketing emails from: Lenskold Group, 601 Bangs Avenue, Suite 504, Asbury Park, NJ, 07712, https://www.lenskold.com. You can revoke your consent to receive emails at any time by using the SafeUnsubscribe® link, found at the bottom of every email. Emails are serviced by Constant Contact

By submitting this form with the Subscribe button checked, you are granting: Lenskold Group, 601 Bangs Avenue, Suite 402, Asbury Park, New Jersey, 07712, United States, https://www.lenskold.com permission to email you. You may unsubscribe via the link found at the bottom of every email. (See our Email Privacy Policy for details.) Your e-mail will be kept private and only used for educational content from Lenskold Group as outlined in our Privacy Policy. By clicking on the link delivered via e-mail to download content, you consent to use of a cookie that will provide you access to all other content without completing the form again.

Categories
Archived Research

2010 B2B Lead Generation Marketing ROI Study

Lenskold Article Series

by Jim Lenskold

2010 B2B Lead Generation Marketing ROI Study

This research archive offers good insights into using marketing ROI and measurements to guide lead quality and lead nurturing marketing.


  • Which types of lead generation marketing programs are most effective at driving high quality leads?
 
  • What are the strengths and shortfalls for current measurement practices for lead generation marketing?
 
  • Where are the best opportunities to improve lead generation ROI and support incremental budget? (Hint: good info for your lead nurturing programs)
Key issues of measuring and improving lead generation marketing effectiveness were explored in the 2010 Lead Generation Marketing ROI Study. The results were drawn from 231 respondents who indicated that they were marketing practitioners in B2B companies (half or more of their revenues generated from business customers), whose marketing group generates leads for a sales organization or channel partners. The full 31 page report includes detailed findings, recommendations and incorporates comparative adoption from 2008 to 2009. This 2010 research study with B2B lead generation marketers explored practices and priorities for using measurements and return on investment (ROI) to improve marketing effectiveness. Several key findings emerged from this research:  
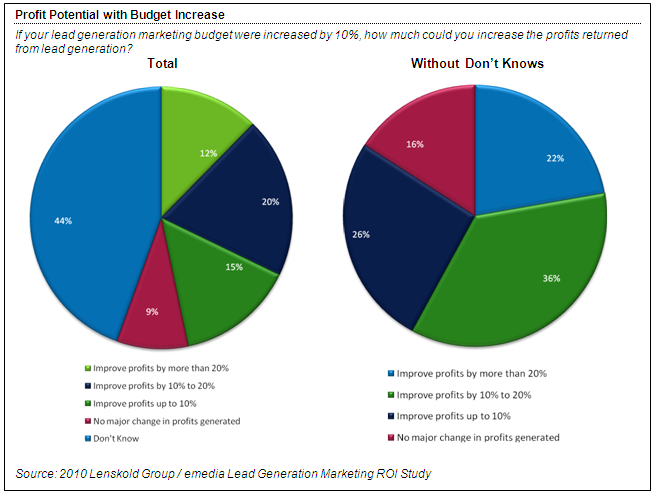
  • Marketers with sufficient insight to estimate the profit potential from an increase in lead generation marketing indicate that there is untapped profit potential. Of those B2B lead generation marketers providing an estimate of the incremental profits from a 10% increase in their budget, 6 in 10 expect a profit increase of greater than 10%. The challenge is that almost half (44%) of the B2B lead generation marketers surveyed lack the insight to estimate the profit potential, responding “don’t know” when asked how much could profits be increased with the additional 10% increase in marketing budget.
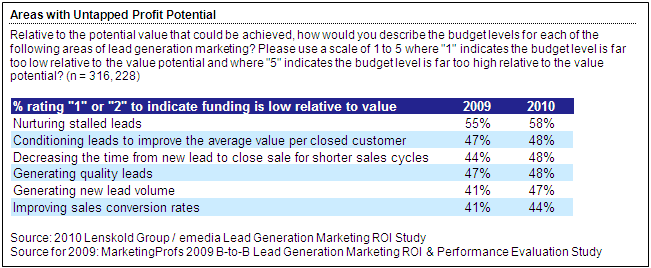
  • Highest profit potential lies with nurturing stalled leads, reported by 58% of lead generation marketers. Close to half indicated that all other areas examined also have untapped profit potential. This is very consistent with the results of 2009 where nurturing also topped the list.
  • B2B lead generation marketers using ROI metrics were more likely to anticipate much greater growth than their competitors (22% vs. 10% of all others).
  • Organizations that use marketing ROI metrics reported higher use of lead quality measures based on customer revenue generated from the initial sale (51% vs. 21% of organizations that use only non-financial metrics) and lead quality based on sales conversion rates (63% vs. 34%).
View this webinar for detailed findings, conclusions and recommendations from the 2010 B2B Lead Generation Marketing ROI Study. Here is one of the many findings from this research:

Fill Out the form to complete the download


By submitting this form, you are consenting to receive marketing emails from: Lenskold Group, 601 Bangs Avenue, Suite 504, Asbury Park, NJ, 07712, https://www.lenskold.com. You can revoke your consent to receive emails at any time by using the SafeUnsubscribe® link, found at the bottom of every email. Emails are serviced by Constant Contact

By submitting this form with the Subscribe button checked, you are granting: Lenskold Group, 601 Bangs Avenue, Suite 402, Asbury Park, New Jersey, 07712, United States, https://www.lenskold.com permission to email you. You may unsubscribe via the link found at the bottom of every email. (See our Email Privacy Policy for details.) Your e-mail will be kept private and only used for educational content from Lenskold Group as outlined in our Privacy Policy. By clicking on the link delivered via e-mail to download content, you consent to use of a cookie that will provide you access to all other content without completing the form again.

Categories
Article Library rio resources

Maximizing Lead Generation Marketing ROI Part 4: Dashboard Metrics

Lenskold Article Series

by Jim Lenskold

Maximizing Lead Generation Marketing ROI Part 4: Dashboard Metrics

This is the fourth article in the four-part series on Maximizing Lead Generation Marketing ROI. The other articles in this series include:

Part 1: Lead Quality Counts
Part 2: Insight, Alignment & Action
Part 3: Measuring Effectiveness

In addition to measurements for specific tactics, which we covered in Part 3 of this 4-part series, marketing executives must be attentive to overall performance management. This involves monitoring and measuring key metrics to understand the collective impact of all marketing and sales efforts, to ensure business goals can be met, and to support business decisions.

The objective of our dashboard metrics is not reporting as much as capturing insight that can be used to improve performance. You want to select and define a set of metrics that 1) collectively reflects what is driving financial performance, 2) shows early indicators of future performance and 3) identifies specific areas of weakness where improvements can be beneficial. In this article, I’ll define 17 metrics specifically for lead generation marketing, which you can consider as you develop your performance management dashboard.

Framework for Key Metrics

Lead generation marketing plays the critical role of surfacing and engaging potential buyers to provide new and better prospects for the sales organization. For lead generation, key metrics must provide insight into lead quantity, lead quality, lead outcomes, and cost management. In addition to managing total leads to ensure business goals are met, the most critical metrics are those that assess marketing effectiveness in contributing to the primary profit drivers for the business, which include, 1) sales conversion rate, 2) incremental profit per customer, and 3) the cost per sale (see diagram below).

Lead Generation metrics can be organized into the following categories:


  • Funnel progression metrics – covering conversion rates from initial contact through closed sale
  • Customer value metrics – covering the financial value that results from the leads generated
  • Cost management metrics – covering the expense side
  • Goal attainment metrics – ensuring quantity and quality come together to meet business objectives

Funnel Progression Metrics

We can break funnel progression metrics into the following four sub-categories that provide insight into conversion quality:


  • New Leads
  • Sales Acceptance
  • Sales Readiness
  • Purchase Velocity

For each of these, we have a number of key metrics to consider.

New Leads

This first set of metrics is used to assess marketing effectiveness in terms of generating the right number and the right type of leads.

Marketing Qualified Lead Rate combines several stages in the funnel to incorporate a quality component into the marketing effectiveness assessment. This metric looks at the number of marketing qualified leads (MQLs) that are generated from all marketing contacts. This ratio improves as your marketing initiatives become more effective at generating more qualified leads, or more efficient at screening out low potential contacts.


Marketing Qualified Lead Rate = # of MQLs / # of total marketing contacts

Example – Direct marketing campaign promoting Webinar
10,000 contacts reached
800 Webinar participants
200 marketing qualified leads

Marketing Qualified Lead Rate = 200 / 10,000 = 2%

As an alternative, you can split the marketing qualified lead conversion metric into two metrics. This will provide more detail but the metrics must be used with caution, since improvements to the single metric may not align to improved business results. You will see that the two examples below match up to the example above.


Engagement Rate, in some cases referred to as a response rate, indicates how well Marketing generates some form of action from its targeted contacts. It is focused more on lead quantity than lead quality. Some marketing programs will generate fewer, high quality leads while others will attract a high response among lower quality of leads. This metric can be used to diagnose problem areas or compare how different marketing programs can be used in the marketing mix but is a low priority metric in terms of managing lead quality and goal attainment.

Engagement Rate = # of contacts taking action / # of marketing contacts

Example – Direct marketing campaign promoting Webinar
10,000 contacts reached
800 Webinar participants

Engagement Rate = 800 / 10,000 = 8%

Lead Qualification Rate is used with the engagement rate metric to determine how many of the “engaged” contacts qualify for Marketing to hand off to Sales. This screening step is not always included as a marketing responsibility, however, as we have noted in the first three articles of this series, it is a step that significantly impacts marketing profitability.

Lead Qualification Rate = # of marketing qualified leads (MQLs) / # of leads generated

Example – Webinar participants qualified via marketing screening process
800 Webinar participants
200 marketing qualified leads

Lead Qualification Rate = 200 / 800 = 25%

Sales Acceptance

Sales acceptance of marketing-generated leads is the next critical step in the process. If Sales is rejecting or even ignoring marketing leads, the marketing budget is not likely to be generating good ROI. The definitions for marketing qualified lead screening should align to the requirements for sales qualified leads (although not as strict).

Sales Acceptance Rate is one of the best indicators of lead quality, and could easily be labeled as the “Lead Quality” metric. It is the ratio of sales qualified leads to marketing qualified leads. It serves as an excellent indicator of how well Marketing is qualifying and screening leads to maintain high quality levels. A good target to aim for is 70% – 80% MQL to SQL.

Sales Acceptance Rate = # of Sales Qualified Leads (SQLs) / # of MQLs

Example – Marketing qualified leads from Webinar passed to Sales
200 MQLs passed to Sales
120 leads accepted as SQLs

Sales Acceptance Rate = 120 / 200 = 60%

Opportunity Rate tracks lead quality at a more precise level than the Sales Acceptance or Marketing Qualified Lead Rate metrics. Opportunities are typically defined by the Sales organization as leads that have clearly defined needs, purchasing authority, an expectation to purchase within a reasonable time period, and budget. This metric is assessing Marketing’s ability to generate leads that are generally ready to buy. It is based on the percent of leads generated converting to an opportunity.

Opportunity Rate = # of Opportunities / # of MQLs

Example – Marketing qualified leads passed to Sales and qualified as opportunities
200 MQLs passed to Sales
80 leads converting to Opportunities

Opportunity Rate = 80 / 200 = 40%

You can substitute number of leads generated in place of the number of MQLs passed to Sales if that works better for your organization.

Sales Pipeline Metrics


Too often, Marketing does not have system access to track their leads through the sales pipeline. As we have established in the first three articles of this series, Marketing must have insight into and contribute to influencing prospects at all stages of the purchase funnel. Marketing can have a significant role in creating “sales readiness,” especially in those firms making the argument to invest in branding to create stronger differentiation, and the best measures to understand the impact of those efforts are in the conversion rates within the sales funnel. The other significant benefit in tracking sales conversion rates is to understand sales effectiveness and where additional marketing support can improve the net sales rate (remember from Part 1 that improving conversion rates late in the purchase funnel has high ROI potential).

Opportunity to Close Rate summarizes the overall sales pipeline performance from the point of identifying a viable buyer to winning the sale. This can be further split into conversion rates for each major stage in the pipeline (such as opportunity to meeting, meeting to proposal, proposal to close) to provide more detail, but these two points work fairly well in representing the area that Sales manages. This detail is extremely valuable in diagnosing weak areas in the sales cycle.

Opportunity to Close Rate = # of Closed Sales / # of Opportunities

Lead to Close Rate (or Lead to Purchase Rate) captures the net outcome of the leads generated. This assesses how many leads passed to sales (MQLs) convert into sales.

Lead to Close Rate = # of Closed Sales / # of MQLs

Sales Capacity (or # of Leads per Rep) is also a good indicator of sales performance. This is the number of active leads managed divided by the number of sales people managing those leads. There is a point where the number of active leads begins to hurt sales effectiveness and this metric should show when that point is reached.

Sales Capacity = # of Active Leads / # Sales Reps

Purchase Velocity

Monitoring the pace of leads moving through the sales cycle provides additional insight that is often missed. There are two high priority metrics in this category.

Lead Contact Velocity is the average number of days between leads being handed off to Sales and Sales making initial contact (or contact attempts). It is an excellent indicator of sales capacity and can help in understanding why lead quality might mistakenly be viewed as declining. We had a client who could not determine why fewer and fewer leads were converting to opportunities, only to discover that the average days for the first contact had changed from 3 days to 14 days.

Lead Contact Velocity = Average # of Days from lead passed to lead contact

Lead to Close Velocity, also referred to as the sales cycle time, is the average number of days between a lead being handed off to Sales, and the closed sale date. As the sales cycle duration increases, it increases the cost to the sales organization, increases the number of active leads that need to be managed, and typically means a lower sales conversion rate. This metric lets the marketing organization know if additional effort needs to be put against sales readiness, or if additional tactics are necessary within the sales pipeline.

Lead to Close Velocity = Average # of Days from lead passed to closed sale

Customer Value Metrics

In addition to conversion rates, the other component of lead quality is customer value. By “value,” we are referring to the incremental profits generated from new customers and/or new sales. While revenue and sales volume are important, we must get to profits if we are going to assess ROI and ensure that our marketing programs generated more than we spent.


Customer value metrics help the marketing organization 1) improve targeting, 2) improve effectiveness in attracting higher value leads, and 3) improve customer purchase decisions to buy more or buy higher value products and services.

Average Profit per Customer should consist of the net present value of incremental customer profits generated as a result of this campaign. It encompasses the current purchase and the repeat purchases likely to follow (without additional investment in up-selling and cross-selling). This metric could easily be modified to alternatives such as Average Profit per Sale (if buyers are not known or tracked), or Average Profit per First Time Buyer.


Average Profit per Customer = total incremental profits / # of customers buying

Other metrics that reflect specific portions of customer value include Retention Rate (or Repeat Purchase Rate), Average Profit per Order, and Average Orders per Year (or any other time period).

Cost Management Metrics

You want to be careful with cost metrics since any positive changes to conversion rates or customer value can easily justify increased costs. However, you do want to look for opportunities to generate the same lead quality with less expense.


The three cost management metrics that each show a slightly different perspective are
Cost per MQL, Cost per Opportunity, and Cost per Sale.

Cost per MQL (or Cost per Lead if you do not have a qualification stage) provides a very narrow, marketing-only perspective that ends with the marketing leads. It is okay but not ideal.

Cost per MQL = Total Marketing Cost / # of MQLs generated

Cost per Opportunity is probably the best metric for lead generation marketing since it sets the objective that leads should be screened and nurtured properly and ready for the sales cycle.

Cost per Opportunity = Total Marketing Cost / # of Opportunities from MQLs

Cost per Sale is another excellent metric which provides an integrated Marketing and Sales perspective. This includes both the marketing and sales expense so it motivates Marketing to provide fewer, better leads.

Cost per Sale = Total Marketing & Sales Cost for a set of leads / # of closes sales from the same set of leads

Goal Attainment Metrics

All of the metrics so far provide insight into your effectiveness and lead quality, but it is possible to improve quality and then not have enough leads to reach your goals. This last set of metrics helps ensure that you (Marketing and Sales together) are on track to meet the financial objectives of the company.

Number of Active Leads per Period lets the marketing organization know if there are enough leads to reach the sales goals for upcoming periods. This metric can indicate a sales capacity issue when too high, letting Marketing know to reduce new leads. You could use the metric Lead Volume per Period, which represents the total number of new leads that Marketing delivers to Sales, but that does not take into consideration sales capacity and does not ensure there are enough leads in the pipeline to generate the right number of sales.


Number of Active Opportunities per Period is an alternate version that will be more predictive of future sales volumes. For either metrics, the sales organization should know how many active leads or opportunities are necessary to meet closed sales goals. This is determined by using your target number of closed sales and your conversion rate. For example, if your Opportunity to Close Rate is 10% and your target sales for each month is 20, then at any given time, the sales organization needs to have 200 active opportunities. This is calculated by dividing the sales goal by the conversion rate (20 / 10% = 200). The time period is not relevant as long as the Lead to Close Velocity remains steady.


Projected Profit per Active Opportunity is the ideal metric to monitor the financial value of the pipeline. It is used in conjunction with the Number of Active Opportunities per Period and the Opportunity to Close Rate to forecast the future flow of profits from new sales. Realistically, this is more often tracked as projected revenue per opportunity. While revenue does not show the true relative value of different opportunities, it tends to fit the sales management process well.


Total Sales Volume per Period is an important outcome metric that is used with the Average Profit per Customer to manage the financial performance from new sales.

Metrics Selection

We’ve covered a good set of metrics in several categories to monitor and manage overall lead generation performance. These metrics extend into the sales pipeline, which is required to truly manage the marketing impact on business outcomes, so work must be done to set up access and tracking.


Your primary metrics should be as comprehensive as possible in covering lead quality (conversion rates and customer value), cost management, and goal attainment (lead quantity). Each marketing organization will have a unique set of metrics. Your final set of metrics will be determined by:


  • The availability of the right data to track lead outcomes, including the sales pipeline
  • The quality of tracking data since you need to avoid using data that will report inaccurate metrics
  • The customer relationship, since the detail of tracking data is dependent on your ability to know progression through the funnel stages
  • Your decision process, since your dashboard and metrics should be defined based on how the marketing organization makes decisions to manage their performance.

This concludes our 4-part series on Lead Generation ROI. There is clearly a significant opportunity to improve the ROI of lead generation marketing with better measurement and management processes. Whether it is better alignment with sales, better metrics, or leveraging new insights to guide marketing strategies and tactical decisions, every step forward will result in improved marketing performance and profitability.


Return to Part 1: Lead Quality Counts >>

Categories
Article Library rio resources

Maximizing Lead Generation Marketing ROI Part 3: Measuring Effectiveness

Lenskold Article Series

by Jim Lenskold

Maximizing Lead Generation Marketing ROI Part 3: Measuring Effectiveness

This is the third article in the four-part series on Maximizing Lead Generation Marketing ROI. The other articles in this series include:

Part 1: Lead Quality Counts
Part 2:Insight, Alignment & Action
Part 4: Dashboard Metrics

How do you know if your lead generation program is working and delivering a good ROI for the company? You may be doing some lead tracking to understand conversion rates and customer profitability, which is great. But the sales team will inevitably let marketing know that 1) marketing was just a small step in closing the sale so they deserve the credit, 2) they would have found and closed those leads anyway so there is no incremental value, or 3) the leads are fine but there is just never enough. We need reliable measurements to both prove and improve our marketing effectiveness.

The first two parts of this article series have outlined what is necessary to improve lead quality (covered in Part 1) and how to improve sales alignment for better lead transition, tracking, and sales support that increases the close rates of those leads (covered in Part 2). We’ll now look at the measurements challenges for lead generation as we provide insight into the most common questions lead generation marketers raise with respect to measurements.

Lead Generation Measurements

Measurements around lead generation are made easier by the fact that once a contact is generated, their interactions and outcomes can be tracked (systems and operational issues aside). But there are also a number of challenges unique to lead generation, which require a closer look at what it takes to get reliable measurements.

Let’s address the most common measurement questions, starting with the basic and moving to more advanced. As you look through these, keep in mind that there are four primary categories of marketing measurement that we can have to assess the incremental impact of marketing: pre-post tracking or trending, market testing, modeling, and surveys.

How do you match lead contacts to buyer contacts when different people from the same company are involved in the buying process? (lead tracking)
 

This match-back challenge can occur when the basic measurement technique is to track from the marketing tactic generating the lead to closed sale. In some companies the sales system does not contain enough detail to link the marketing contact, who may be a recommender or decision-maker, with the buyer, who may be from procurement or another person on the purchasing “committee.” You have a contact that is engaged with your marketing and passed into the sales organization as a lead but your only tracking option is to go to a purchase database and try to make a match.

If you choose to match by contact name, you will under-state your marketing impact since you know many of the buyers listed in the financial system do not represent the full set of decision-makers and recommenders you influenced. But if you match by just company name (as I have seen companies do), you will over-state your marketing impact, especially if you have a reasonable number of large clients with multiple buying groups.

A good compromise for those companies limited to some form of match-back is to match by company name and location. It is still subject to error but gets closer than either extreme. An alternative is to use periodic surveys of your marketing contacts to determine the sales close rate. The survey can also be used as a checkpoint or calibration of your match-back process.

Which marketing tactic gets credit for the lead? (multi-touch marketing assessment)
 

Prospects are typically touched by multiple marketing contacts prior to qualifying as a lead that is put into the sales cycle. In most lead measurements, the last marketing contact gets credited for generating the lead. When most of your marketing efforts are response-oriented, this approach can work fine. Every marketing contact is generating a level of interest and it took that last marketing contact to get a certain set of prospects to become leads. This tracking approach will under-value marketing initiatives that are better at generating interest and boosting the response for other marketing initiatives and it can also over-value marketing touchpoints that pick up leads that would have otherwise come in through other contacts.

The solution is not to allocate credit to multiple contacts but to set up measurements that isolate the incremental impact of specific marketing initiatives. This can be done through market tests when assessing specific tactics, or through modeling when assessing multiple tactics and their interaction effects. Modeling can establish correlations to identify which touchpoints are most influential in generating leads or closed sales.

Note: For a more detailed explanation of options and issues see our archived article “Measuring the Impact of Multi-Touch Marketing.”


What incremental impact has marketing generated? (structured measures)
 

The best measure to show the true incremental impact of marketing is market testing using test and control groups. I am generally not an advocate of complete “no-contact” control groups which require eliminating marketing contacts for the purpose of demonstrating the incremental value of marketing because we are typically not trying to prove that no marketing is a viable alternative. While there are some instances where these complete no-contact control groups make sense, more often we will set up control groups that have “business as usual” marketing and sales contacts with the exception of a select marketing initiative(s) that are withheld. Market testing is also very effective to build the case for adding new marketing initiatives.

For lead generation marketing, there are a number of market test measurements that are particularly worthwhile to address your more critical marketing decisions.

1. Test a marketing tactic or integrated set of tactics to determine the incremental lift on leads generated.

For direct marketing, your approach is to withhold specific direct mail or e-mail communications from a random sample control group to determine the incremental lift in generating leads. If the control group nets the same proportion of qualified leads as the test group, it is likely that your other lead generation activities are capturing the opportunities out there. Any lift in the test group over the control group is attributed to your marketing.


Mass marketing tests require a geographic split of comparable markets or regions, matched through careful sales trend analysis. The test markets receive the incremental marketing to determine the incremental lift in quality leads.

2. Test the incremental value of lead generation marketing to the sales organization in terms of incremental sales conversions and average customer value.

The same testing approach outlined above can be used to assess the impact on closed sales rates or average customer value (in addition to lift in leads). This comparison is very appropriate when the sales organization is trying to make the case that marketing is not adding value to the sales process or that the leads generated would have been identified through the sales organization anyway. The analysis should determine if the test group receiving marketing contacts experiences more leads, a higher net close rate, and/or higher average customer value per sale than those receiving no or less marketing contacts. This may require withholding marketing for the select accounts for a long period of time and it is justified when there is an established belief that less marketing is needed. If you set up your tracking to monitor performance changes during the test, you may be able to detect a decline in performance early, at which time marketing can be resumed instead of allowing the control group to hurt sales results.


Keep in mind that measurement success is dependent on having statistically significant sample sizes to minimize the normal variance that might occur if you created the two groups and treated both the same. There are analytic processes that can help set up the experimental design. Also be sure to eliminate possible biases – for example you are better off comparing a portion of each sales rep’s accounts than splitting the sample by account rep when the rep performance may vary.

3. Test and assess new marketing initiatives.

The addition of new marketing initiatives can easily fit into a market test structure. If the marketing initiative is planned to launch nationally and there is the flexibility to do so, a measure of the initial impact can be obtained through a phased-in launch that occurs regionally. Control groups are set up within the regions launching last. The primary objective of the measurement should be on improving the new marketing initiatives (as opposed to continuing vs. canceling). So the analysis should look deeper than bottom line results for insights such as identifying that the marketing is working with specific target segments or where in the customer funnel the performance is stronger or weaker.

4. Test extending lead generation programs beyond just lead volume to determine the potential for nurturing programs or sales support marketing.

As we addressed in the first two articles of this series, there are often opportunities to improve lead generation effectiveness not by increasing lead quantities, but by either increasing the conversion rates within the sales pipeline or by nurturing leads that were generated but not yet qualified. The ROI analysis can be used to show the profit potential of these initiatives. Market testing is used to develop effective programs on a small scale with minimal budget and then build the case for additional funding.

How do we measure leads passed to external channel partners and resellers? (collaborative measures)

When marketing organizations are passing leads to external channel partners, there is often a huge gap in tracking that ultimately leads to the challenge identified in our first question above on accurately matching contacts to buyers. There are several measurement approaches specifically for third party relationships which are worth consideration.

1. Set requirements for channel partners to report lead outcomes on a regular basis. Some companies are very successful with this approach, typically because they have good quality leads that the channel partner is willing to work for. In other cases, the channel partner views the customer relationship as their own and will not such disclose details. The goal is to find the win-win that improves marketing effectiveness which is beneficial to both parties.


2. Set up a joint market test. This works well when testing new initiatives. If the channel partner understands that your company needs to demonstrate the value of the specific lead generation investment to benefit both organizations, they may provide enough quality feedback for an assessment (maybe excluding customer details).


3. Use survey research. Survey your leads periodically to measure their final purchase decision. Surveys are also a good opportunity to get detailed information on their funnel progression, leakage reasons, and insight into competitive considerations.

Here is a brief re-cap of how different methodologies can be applied to assess lead generation marketing effectiveness:


  • Pre-post tracking is an easy, low-cost measurement that provides insight into relative effectiveness based on crediting just the final lead source. It is not entirely reliable but offers directional information that can improve performance.
  • Surveys can help close data and tracking gaps. This is also a good methodology when assessing marketing programs where sales are closed through channel partners or resellers that do not report sell-through data back to your company.
  • Market testing is very effective for isolating the impact of a specific set of tactics or the introduction of new campaigns. This also works well to identify the incremental lift of brand marketing on lead generation effectiveness.
  • Modeling is the best solution to assess multiple marketing channels. More advanced modeling techniques can be used to assess the impact of non-marketing factors on your marketing effectiveness such as sales coverage, competitive activity, or market conditions.

In the next and final article of this series on lead generation ROI, we’ll cover lead generation metrics and how these are used to manage your overall performance.


Continue on to Part 4 >>

Categories
Article Library rio resources

Maximizing Lead Generation Marketing ROI Part 2: Insight, Alignment, & Action

Lenskold Article Series

by Jim Lenskold

Maximizing Lead Generation Marketing ROI Part 2: Insight, Alignment, & Action

This is the second article in the four-part series on Maximizing Lead Generation Marketing ROI. The other articles in this series include:

Part 1: Lead Quality Counts
Part 3: Measuring Effectiveness
Part 4: Dashboard Metrics

You run your marketing, generate those high quality leads discussed in Part 1 of this article series, hand these leads off to the sales team, and wait. Hey guys, anything happening over there with our leads? Dead silence. The execs are asking about the ROI on your marketing efforts but you seem to have lost sight of the financial returns which may or may not be present in the black hole where you pass your leads into. The financial success of lead generation marketing is very much dependent on how those leads are managed after the marketing handoff to sales.

The need to better align the sales and marketing organizations is generally well-known. These two organizations are connected through their shared roles in motivating customer purchase activities and divided by different cultures concentrating on different portions of the customer purchase funnel. No one can argue with the fact that alignment is good, but what must you ultimately accomplish to drive performance and profitability?

The big opportunities are tied to driving better informed actions, which is a combination of what you know, what you do, and knowing how well you did. Marketing (and the sales team) can prioritize their efforts, allocate budgets, and design high-impact strategies by managing insights, alignment and actions in the following key areas:

  • Lead Transition
  • Funnel Tracking
  • Sales Effectiveness Support

Lead Transition

You’ve invested marketing dollars into generating those leads with the expectation that as many as possible will proceed on their journey to become closed sales. Just like passing the baton in a relay race, the handoff of leads from marketing to sales must be as seamless as possible during this transition stage. The key metric to manage here is the ratio of Marketing Qualified Leads to Sales Qualified Leads (MQL/SQL) which represents the percentage of leads sales qualifies and accepts.


There are two primary gaps in this transition that work against generating positive ROI from your lead generation. The first is lead quality, which we covered in Part 1. We showed the economics behind prioritizing lead quality over quantity and also stressed that feedback from the sales team is essential to align marketing’s view of lead quality to sales’ definition of quality.


The second gap that is all too common and is a pitiful example of poor management processes is the lack of follow-up contact from sales. The opportunity to generate good returns on lead generation marketing investments quickly fades without timely sales contacts as those good leads in the mix turn cold.


Why would the sales team not follow up on marketing leads? The three primary reasons are:


  • Poor lead quality – We’ve already established that marketing must own lead quality as long as sales is providing feedback to define lead quality. However, if you have just recently improved quality, your challenge is to overcome old perceptions of quality problems.
 
  • Sales capacity – This is another critical area where marketing needs a feedback loop from sales as well as a process to effectively manage the peaks and valleys of capacity. When volumes are exceeding capacity, marketing must work with sales to manage lead handoff by either holding and nurturing leads or tapping into external sales support resources.
 
  • Compensation Structure – There are some situations where the sales team earns more compensation on sales-generated leads than on marketing-generated leads. If they are putting more effort on their own leads instead of contacting marketing leads, you have to determine if it is best to change the compensation structure, add more sales staff (internal or external), or cut back on lead generation marketing.

The ROI analysis used to assess lead generation marketing helps to prioritize the process changes necessary to improve the communication flow and alignment with sales. Leads that get lost in the transition are a wasted use of marketing resources and a missed profit opportunity.

Funnel Tracking

As your leads successfully make it through the transition to the sales organization, you are now interested in their travels through the purchase funnel. This is an area that is all about building insight on customer behaviors and marketing/sales effectiveness. This insight is ideal for enriching strategy and targeting. But of course, you are still dependent on the sales team for feedback on the lead outcomes as they progress through the funnel.


The insight you are after includes:


  • Leakage points – You need to know where leads fail to progress to the next stage of the buying cycle, either because the competition won them away or they stalled or cancelled their purchase decision.
  • Leakage drivers – In addition to where leads leak in the funnel progression, you want to know why. This insight should identify strategies that can be used to modify branding and lead generation marketing, improve sales management, create new marketing initiatives, and enhance product and pricing decisions.
  • Quantify Lost Value – Through sales management systems or rough estimates, the opportunity value can be used to quantify the lost revenue and profits associated with specific leakage points and leakage drivers. When you establish a financial value to problem areas such as leads not contacted, opportunities lost because of no budget or opportunities lost because of no management approval, you can then create the business case for new marketing strategies that address those drivers.

More detailed purchase funnels, preferably described from the buyer’s perspective, allow for better assessment of your weak points. But even with sales automation that captures funnel performance and leakage drivers, too much detail will become a burden on the sales team. Instead, use survey research to periodically conduct a more comprehensive analysis.

Sales Effectiveness Support

As you break down these barriers between marketing and sales, you will find additional ROI potential for marketing within the sales cycles. This is more than just basic sales support where marketing provides collateral or presentation decks for the sales team to use as needed. You want to leverage the insight you gain with funnel tracking to strategically develop marketing initiatives that improve your profitability through:


  • Better funnel conversion rates – As we mentioned in Part 1 of the article series, if 90% or more of leads are not converting into sales, you have a lot to work with. Converting more marketing leads to sales helps the ROI of both the additional marketing support in the sales cycle and your initial lead generation marketing.
  • Incremental customer value – Marketing running concurrent with sales management of leads can help shift purchase decisions to higher value and higher profit margin products and services. The sales team is going to put their emphasis on closing the sale while marketing can concentrate on making the better mix of products and services more appealing.
  • Increase lifetime value – In addition to improving the value of the current purchase, marketing can work on motivating repeat purchases and retention to extend the value of the customer. Analyzing purchase behaviors and profiles of long-term customers provides insight on how to better influence the customer relationship in earlier stages.
  • Shorten the sales cycle – With a detailed ROI calculation that includes the cost of sales resources, your marketing efforts to shorten the sales cycle can be quantified in the reduced cost of sales time. Shorter sales cycles also tend to increase conversion rates.

It is generally more profitable to increase conversion of existing leads than to generate more leads. Think of this as a continuation of your lead generation effectiveness instead of a separate effort.


Alignment between marketing and sales involves sharing insights on lead outcomes and managing lead success jointly through the entire process. Improvements come from understanding and strategically addressing leakage points and leakage drivers. Your ROI analysis will help prioritize and allocate budgets where you can have the greatest influence on the primary profit drivers of increasing conversion rates, improving customer value, and reducing costs for both marketing and sales.


Now that we have established the insights you need to know, Parts 3 and 4 of this article series will conclude with measurements and metrics for lead generation.

Continue on to Part 3: Measuring Effectiveness >>

Categories
Article Library rio resources

Maximizing Lead Generation Marketing ROI Part 1: Lead Quality Counts

Lenskold Article Series

by Jim Lenskold

Maximizing Lead Generation Marketing ROI Part 1: Lead Quality Counts

This is the first article in the four-part series on Maximizing Lead Generation Marketing ROI. The other articles in this series include:

Part 2: Insight, Alignment & Action
Part 3: Measuring Effectiveness
Part 4: Dashboard Metrics

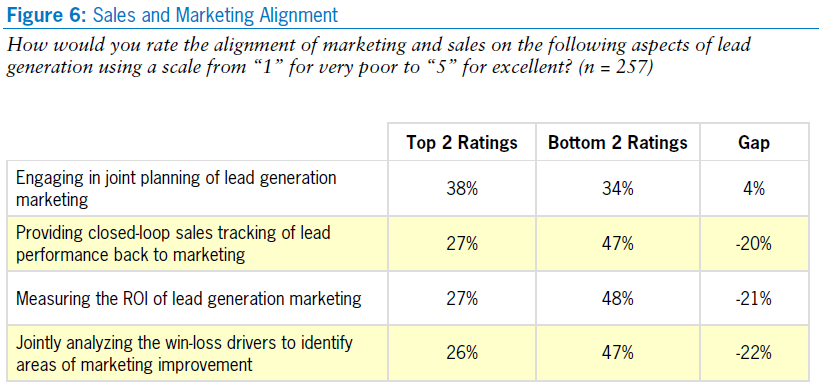
Marketers responsible for lead generation are all too familiar with some common challenges –getting closed-loop feedback from the sales organization, measuring marketing effectiveness beyond just lead quantity and cost per lead, and building strong alignment with the sales organization. As presented in the MarketingProfs’ 2008 research report, B-to-B Lead Generation: Marketing ROI and Performance Evaluation Study effective lead generation marketing is very much tied to overcoming these challenges to prioritize lead quality over lead quantity.

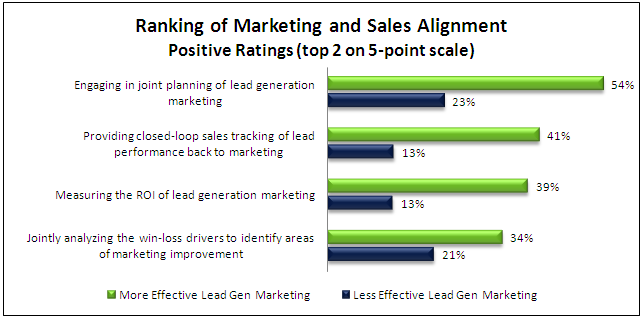
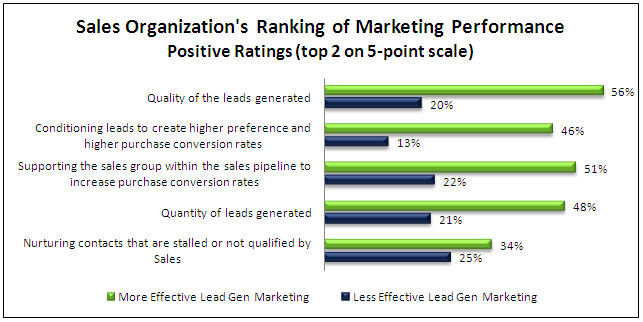
The research report released in June 2008 showed that companies rating their lead generation marketing as more effective than competitors were three times as likely to report a strength in closed-loop sales tracking and measuring the ROI (return on investment) of their lead generation marketing. More than half of the marketers with more effective lead generation marketing (56%) expect that their sales organizations would rate the quality of leads as positive (top two scores on a 5-point rating scale) compared to just 20% of those with less effective marketing.

Lead quality is critical to managing and improving bottom line performance. In addition to these research findings, basic ROI analytics can be used to make your case to prioritize quality over quantity and guide your decisions to deliver greater performance and profitability. You ultimately need better insight into the two primary dimensions of quality – average profit per sale and average conversion rates from lead to sale. With insight into lead quality and ROI, the marketing team can unlock untapped opportunities with:


  1. Better alignment of the marketing spend to value potential
  2. Improvements to marketing strategy
  3. Better tracking and metrics
  4. Earning buy-in from the sales organization

We’ll run through some basic math first to build the support for acting on the strategy, metrics, and alignment opportunities.

Marketing Investment Levels Aligned to Value Potential

Cost per Lead is a very commonly used marketing metric (used by 34% of B2B lead generation marketers according to our research). It can be an insightful metric but it is highly dependent on all leads having the same value and conversion potential, which is rarely the case. If your cost per lead goes up but you bring in better quality leads with either higher profit per sale or conversion rates, it will be a worthwhile investment. Marketing effectiveness can be improved with “value-tiered marketing investments” that align marketing spending with the expected returns for better ROI performance.


For example, you may be marketing to a target audience that has an average profit per sale of $4,000 (based on $16,000 revenue * 25% gross margin) and a lead-to-sale conversion rate of 7%. To achieve an ROI of 25% the maximum Cost per Lead is calculated as $224. The calculation is presented below.


Maximum Cost per Lead = ($4,000 / (1 + 25%)) * 7% = $224


But suppose the target audience is made up of three equal-size segments with the following performance patterns:

Segments

Conversion Rate

Profit per Sale

Segment A

6%

$5,000

Segment B

10%

$4,000

Segment C

5%

$3,000

Total (average)

7.0%

$4,000

Segment A has the highest value, while Segment B has a highest conversion rate. It does not make sense to manage our marketing investment using the average Cost per Lead. Instead we run the basic calculation to determine the maximum Cost per Lead per segment.

Segments

Conversion Rate

Profit per Sale

Maximum Cost per Lead

Segment A

6%

$5,000

$240

Segment B

10%

$4,000

$320

Segment C

5%

$3,000

$120

Total (average)

7.0%

$4,000

$224

Now we can see that more marketing can be invested into Segment B based on the higher quality of the lead. In fact our previous marketing to Segment C that averaged $224 Cost per Lead was actually costing more in marketing than the profits returned and therefore hurting the company’s financial performance.


This is a very basic financial analysis which can be replaced with more advanced versions that take into account the sales investment in addition to the marketing investment and multiple stages of conversion rates from initial sales acceptance of leads through the sales pipeline. The other benefit of improving lead quality is that the cost of sales resources will be reduced as the leads unlikely to convert to a sale are removed from the sales pipeline. In the advanced versions of the ROI analysis, this becomes apparent.


Regardless of the level of sophistication, we have at least established the economic view of why lead quality and targeting are important to drive effectiveness, performance, and ROI. Segmentation of targeted prospects based on the two dimensions of lead quality allows you to invest more in high profit-potential segments and reduce spending with low profit-potential segments.

Improvements in Marketing Strategy

There are a number of key areas of marketing strategy that can benefit with better insight into lead quality. The most significant driver of ROI is targeting so improvements here are a top priority. Lead generation marketing can reach a broad audience with many different types of marketing tactics. The goal is to concentrate additional tactics and offers on the top segments of prospects. This is where lead scoring and predictive modeling can be used to set the priorities and establish investment levels based on the conversion probability and value probability.

Better marketing conditioning and nurturing of leads prior to the hand off to the sales team improves conversion rates. Improvements in the effectiveness of this stage of marketing can be assessed using lead-to-sale conversion rates and incremental customer value per sale. Once again, a basic ROI calculation can demonstrate how investing in additional marketing touchpoints prior to handing leads off to sales can generate significant returns from increased revenues.


The focus on narrowing the marketing efforts on fewer but better prospects to deliver higher quality leads always sparks the same question – “but what if the volumes drop too low?” If you apply the ROI analysis shown above and identify the point of diminishing returns – that is the point where the cost per lead is too high to reach your ROI target – it is certainly possible that your total lead quantities will decrease. But when you reach the point where your lead generation marketing will no longer be profitable, quantity will not help. You must then shift your priorities to improving effectiveness with the leads you are already generating. To achieve this effectively, marketing must be working in step with the sales organization to improve conversion rates within the sales pipeline.


Keep in mind that improving conversion rates in the sales pipeline has very high profit potential, even if lead quantity is not an issue. If only 2% to 10% of leads are converting to closed sales, that means 90% to 98% of the leads are leaking out of the funnel, offering plenty of room from performance improvements. Marketing organizations that are restricted to lead generation with a minimal role in supporting the sales pipeline should look closely at the opportunities here to build the case for better alignment and integration.


As part of your overall funnel management and getting the most value from the leads generated, ROI insight tied to lead quality can also support decisions for marketing to nurture rejected or stalled leads.

Better Tracking & Metrics

Marketing ROI is driven by three primary drivers of profitability – incremental customer value (ideally long-term profits), lead-to-purchase conversions rate, and cost per sale. Add “Total Sales Volume” to that list and you have the four most critical metrics for managing performance – keeping the company’s overall financial performance on track and guiding marketing and sales priorities to reach and exceed goals. These same metrics work at the campaign level to prioritize segments for targeting and guide budget allocation, as addressed earlier in this article. Other marketing metrics should align to these core metrics to provide greater depth of insight that can be acted upon. For example, a metric such as Average Value of First-Time Buyers may serve as an early indicator of a likely decline in future revenues if your marketing is now attracting leads from lower value segments.

In order to use better metrics that reflect lead quality, you must have better tracking – in particular the closed-loop feedback from the sales organization that captures the lead outcomes such as sales acceptance, funnel progression, and conversion to closed sale. The ratio of marketing qualified leads (“MQLs,” which represent the leads marketing deems ready to hand over to the sales organization) to sales qualified leads (“SQLs,” which represent the leads sales accepts as qualified for a sales contact) is very important. Marketing can improve this MQL to SQL ratio when provided with feedback to understand the drivers of rejected leads and profiles of the accepted leads.

Additional tracking detail from the sales organization that can support improvements in lead quality includes:

  • Lead screening reasons (i.e., why MQLs are not accepted as SQLs).
  • Lead progression rates through key funnel stages to show leakage points.
  • Average days from lead hand-off to sales contact (reflecting sales capacity and the “freshness” of leads contacted).
  • Good reporting on leakage reasons (i.e., why they dropped out of the sales pipeline).
  • Joint win-loss analysis to assess leads lost late in the sales pipeline.
  • Analyses of closed sales to provide information on both net close rate and incremental customer value (sometimes available through financial systems instead of sales reporting).

Marketing also has to take responsibility for tracking and maintaining quality data for performance analysis. The Lenskold Group/Kneebone 2008 Marketing ROI & Measurements Study showed that access to data under marketing’s control was a weakness yet had a strong correlation to achieving highly effective and efficient marketing. In particular, marketing must maintain detailed tracking of outbound and inbound marketing touchpoints to prospects during the lead generation process. This information is critical to applying more advanced measurements that can properly attribute sales contribution to multiple touchpoints instead of just crediting the most recent lead source.

Earning Sales Buy-In

Simply wishing for, or even requesting, that the sales organization put extra effort into providing tracking information to marketing is not enough. Marketing must make the case that it can and will act on the information provided. As established at the beginning of this article, lead quality benefits the sales organization as well as the financial performance of the company. Leads with higher conversion rates use sales resources more efficiently. And higher conversion rates and higher value per sale both contribute to achieving sales goals.


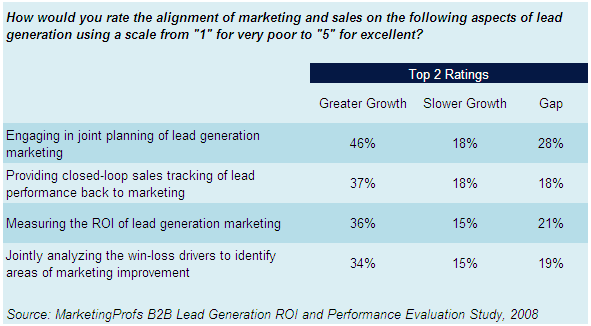
The B-to-B Lead Generation: Marketing ROI and Performance Evaluation Study found that companies outgrowing their competitors had better alignment between sales and marketing than companies growing slower than competitors as shown in the chart below.

One of the most effective ways that we have found to break down the barriers between marketing and sales is to identify and work with a pilot team within the sales organization. The pilot team is typically a group that sees the potential value of lead quality, or is willing to experiment in order to improve performance. The tracking efforts are done without major investments into systems infrastructure or organization-wide process changes.

The closed-loop information provided back to marketing is then applied to improve lead quality from the initial targeting and tactical investments, to marketing’s lead qualification and contribution to the sales pipeline. A basic ROI analysis is used to run scenarios that indicate the key priorities for where additional marketing support can most effectively lead to incremental sales and profitability. Improving lead generation marketing is a continuous journey, but one that offers significant profit potential.

Continue to Part 2: Insight, Alignment & Action >>

Categories
Article Library rio resources

Demonstrate and Deliver Lead Nurturing ROI

Lenskold Article Series

by Jim Lenskold

Demonstrate and Deliver Lead Nurturing ROI

Educating and engaging prospects is a significant part of lead generation marketing. Online channels have made it easier and less expensive to distribute content in an environment where potential buyers are seeking information and open to interaction. Marketing tactics to educate and engage prospects are useful in the early stages of the customer purchase funnel to build awareness and interest and in the middle of the funnel to generate leads. These tactics are also valuable in nurturing stalled leads, which was top ranked in recent research study as the area of marketing that is most underfunded relative to the potential value it can provide (2010 Lenskold Group / emedia Lead Generation Marketing Study.

Lead nurturing has high potential value when your acquisition programs have generated responses from interested prospects, but they are not yet ready to buy. Stalled leads within the sales organization will typically get the periodic call with the “are you ready to buy yet” message. In the absence of a lead nurturing program, the marketing organization may toss the leads back into the prospect pool and let future acquisition marketing bring them back into the lead/sales process. It’s easy to see why marketers believe there is high profit potential here – with low cost marketing contacts to the right target of leads that are not fully qualified or stalled in the sales pipeline, educating and engaging these prospects can increase conversion rates, increase the value per customer, and shorten the sales cycle.

Research shows that lead nurturing has high potential. The 2010 Lenskold Group / emedia Lead Generation Marketing ROI Study revealed that six in 10 lead generation marketers (58%) indicate that nurturing stalled leads is under-funded relative to the potential value.

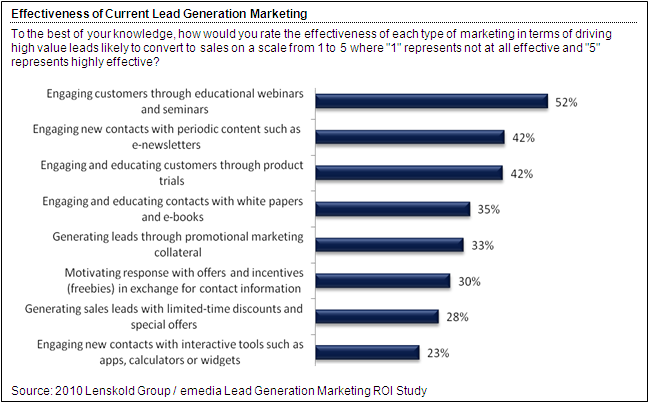
In addition, marketing tactics that work well to nurture leads by educating and engaging customers were ranked highest in effectiveness relative to more sales-oriented tactics. The following chart shows the portion of B2B lead generation marketers that rate their effectiveness as high or very high (4 or 5 on a 5-point rating scale).

Marketers see the value of engaging and educating prospects, as well as establishing lead nurturing programs to enhance their lead generation effectiveness, but the approach is much more challenging to prove out relative to the simplicity of acquisition marketing.


Nurturing Objectives & Strategy

In order to develop a profitable lead nurturing program, you must align the strategies and objectives to the business outcomes it is likely to influence. When evaluating a nurturing program against ongoing acquisition marketing without nurturing, there are three primary financial outcomes that nurturing can increase, in addition to an opportunity to decrease costs.

 
Maintain Awareness & Interest for Increased Lead Volume
 The frequent touchpoints from nurturing marketing, combined with the educational content and engagement opportunities, keep awareness and interest high so that your solution is top of mind as needs change. When a program to nurture stalled leads is integrated into acquisition marketing, the lead volume should increase as more prospects contact the sales organization or accept a contact from sales. Greater volume of qualified leads should result in incremental sales.


Condition Leads for Higher Customer Value

Without a nurturing program in place, another acquisition program may eventually capture a stalled lead who eventually becomes ready to buy. Tactics such as newsletter articles, blog postings, white papers, ebooks, and Webinars provide quality contacts that go well beyond maintaining awareness. These marketing initiatives are providing value to the prospect that is relevant to their needs, providing how-to’s, case studies, deeper insights into potential uses of your products, and expert opinions on your solution. Prospects that re-enter the sales cycle after a period of nurturing should have increased customer value from a higher propensity to purchase higher levels solutions, higher purchase volumes, and longer tenure as a customer.


Increasing Conversion Rates with Shorter Sales Cycles

The educational benefits referenced above should increase conversion rates in addition to customer value. Part of the direct sales relationship is educating prospects on their options. Better educated prospects should therefore move through the sales cycle faster with improved close rates. Shorter sales cycles have benefits beyond financial contribution, such as higher close rates and improved management of monthly or quarterly goals.

Targeting to Nurture High Potential Segments

Many online-based nurturing programs have a low “variable” cost, meaning that once you establish a newsletter, Webinar, or white paper, the cost of adding both high potential and low potential prospects is so minimal , it makes you wonder why targeting is important. But, low potential prospects are expected to eventually generate leads to hand off to the sales organization. Leads likely to have low value or low potential to convert will start consuming more valuable resources in the sales cycle without providing much payback. This is not to suggest that you chase low potential prospects out of these marketing initiatives but that you are selective in the leads fed into the nurturing program.

Targeting and screening should be managed as follows:

Marketing-Generated / Sales-Rejected Leads

The sales organization will accept a portion of these leads. The balance of the leads that are disqualified by sales should be split into groups that are either qualified for nurturing or not qualified contacts for future marketing and sales activity.

Stalled Leads

Once leads enter the sales pipeline, they will be either won (closed sale), lost (no sale), or stalled (no decision or not ready to buy). Stalled leads can become too costly for sales contacts without the benefit off nurturing initiatives that move the contact forward in the purchase funnel. Once again, targeting criteria is necessary to filter out low value and low potential leads that do not belong in the nurturing program.


New leads from acquisition marketing are typically qualified and screened prior to the hand-off to sales. This same screening process will work for re-activated leads from nurturing programs to ensure that only high potential prospects continue into the sales pipeline.

Measuring Lift and ROI

One of the more significant challenges to winning support for lead nurturing programs is the increased complexity in measurements. These programs tend to be longer-term and involve a series of marketing investments that may not have an immediate response or lift. A change in the measurement approach can help.


When making your case for an existing or new lead nurturing program, it makes sense to compare this to the business practices for acquisition marketing and sales management without a nurturing program. The business outcomes of increased leads and sales, higher customer value, and higher conversion rates must be measured over time for the complete nurturing program to which the collective marketing tactics contribute. Measurements can also assess the contribution of specific marketing initiatives within a nurturing program to ensure that education or engagement is truly contributing impact and value.


Many of the short-term metrics marketers use to evaluate educational tactics, such as downloads or event attendance, can work very well as indicator measures. The indicators can determine where tactics may be weak or strong, but be careful not to let these metrics become the goals. You may have tactics that generate low participation rates but have very strong impact on sales conversion or customer value. Examples of both contribution and indicator metrics and measures are shown below.

Metrics & Measurements

Program performance contribution measures


  • Incremental sales conversion rate (tracking/analysis of nurtured vs. non-nurtured prospects)
  • Incremental customer value (tracking/analysis of nurtured vs. non-nurtured prospects)
  • Incremental sales-qualified leads re-activated following stall/drop/disqualification (tracking/analysis of nurtured vs. non-nurtured)
  • Sales cycle time from active lead to conversion (tracking/analysis of nurtured vs. non-nurtured)

Tactic performance indicator measures (short-term)


  • Purchase intention ratings (post-tactic survey)
  • Brand preference ratings (post-tactic survey)
  • Perceived value ratings (post-tactic survey)
  • Engagement rates such as white paper downloads, newsletter click-throughs, Webinar attendance (tracking)
  • Progress on sales qualification metrics such as purchase timing, budget, and need (post-tactic surveys and/or sales qualification contacts)

The performance of specific tactics within a lead nurturing program can be isolated and measured using market testing with control groups to assess the incremental contribution, or modeling to identify which tactics are driving improved conversion rates and customer value.

Demonstrating ROI Lift

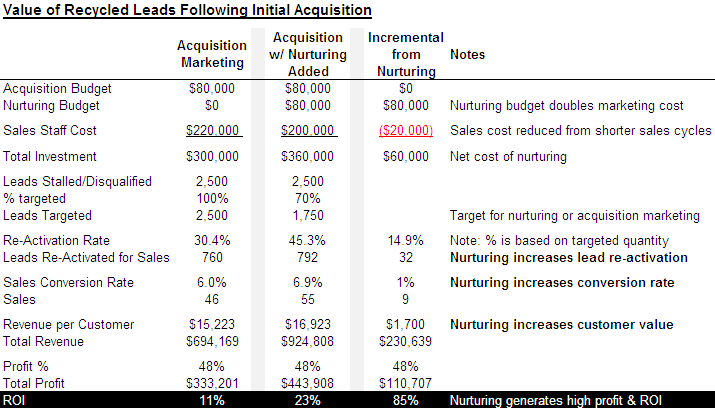
A basic version of an ROI analysis can show how these key metrics can make the case for lead nurturing as shown in the example below. In more advanced versions of this analysis, the assessment could also include more detail on marketing contacts and responses throughout the nurturing period, the sales funnel that leads to the net conversion rate, and drivers of the sales staff cost.

The chart below compares the total cost and impact of a nurturing program supporting ongoing acquisition marketing to the stalled or disqualified leads against the acquisition marketing alone. The difference between the two, shown in the third column, represents the incremental impact generated from the lead nurturing program.

Not all nurturing programs will have influence on all of the profit drivers shown in this example, including reduced sales cost, additional leads, increased conversion rates, and increased customer value. The step of running a basic ROI analysis will show how much lift is necessary to deliver a profitable nurturing program, which helps to focus strategies and objectives, refine targeting, and establish key metrics for measurement. Preliminary assumptions can be used to build the initial budget request to launch or trial a nurturing program.


Lead nurturing requires a sound strategy that can influence the right profit drivers. Marketers must show that nurturing those leads that have the potential to convert into high value customers is worth the extra effort and expense over ongoing acquisition marketing. Marketing tactics must align to the business outcomes so that educational marketing is contributing to higher customer value and conversion rates. With an ROI analysis and quality measurements in place, marketers can develop and deliver highly effective and efficient lead nurturing programs.

Categories
Article Library rio resources

Leveraging Marketing Automation for Better Measurements

Lenskold Article Series

by Jim Lenskold

Leveraging Marketing Automation for Better Measurements

More and more marketing organizations are adopting marketing automation for campaign management, lead management, and the emerging area of revenue performance management. Marketing automation not only improves efficiency, it drives increased marketing effectiveness through better targeting, content management, nurturing, scoring and closed-loop tracking. Most systems have very good reporting but that is only the start for generating more robust measurements with this new source of marketing data and customer behaviors.

Companies that have implemented or are planning to implement marketing automation should understand how these systems support and enable better measurements. There are opportunities to generate better insights into marketing’s contribution to incremental sales, revenue, and profits. I’ll share with you the limitations current systems have in terms of measurement capabilities as well as tips to gain more insights from the tracking capabilities and rich data within these systems to guide marketing decisions towards higher ROI.

Keep in mind that our primary goal for marketing measurements is to guide strategic and tactical decisions so the next dollar spent on marketing is more profitable than the last. Our requirements are different than simple results reporting. We need actionable insight on strategies in addition to comparisons of tactic performance.


Awareness is the first stage in the customer purchase funnel since a potential buyer must be aware of your product or service before evaluating and consciously choosing to purchase your brand. Measurements of the early stages of the customer purchase funnel are dependent on surveys of perceptions such as awareness, consideration, preference and/or purchase intention. This is where the definition of brand awareness becomes incredibly important. If you are making the case that brand awareness has value, you must be able to articulate to executives the exact definition and the strategy for how you expect this will drive a financial contribution for the company.

We’ll cover the following three categories of measurement improvements related to marketing automation:


Better management of basic measures
Modeling & analytics measures using captured data
Key metrics and performance management

This information is not intended to provide a comparison of technologies but instead to provide guidance for improving measurement capabilities using marketing automation technologies such as Aprimo, Unica, Marketo and Eloqua.


Better Management of Basic Measures

Many marketing automation systems have basic measurement capabilities built in to provide detailed results tracking and support for market testing. Current automation solutions are generally managing and measuring direct marketing and online marketing campaigns that track responses, leads, and sales to a specific tactic. Historically, direct response marketing has been well-measured so the new benefits come from campaign reporting that is delivered faster, with less effort and with more detail.


Results tracking measures allow marketers to compare the impact of individual tactics on outcomes such as leads, sales, revenue and profit. While an important measurement tactic, results tracking is a basic measurement approach that does account other marketing and non-marketing factors influencing those outcomes; yet it offers plenty of insight. This measurement approach allows for comparisons to identify higher performing tactics and weaker tactics that need to be improved or eliminated. Results measurements can provide a good indication of relative ROI when comparing the financial contribution against the cost for each tactic.

Recommendations to get the most from results tracking measurement processes follow:

Track or project results through to sales conversion and average profit per sale for a more accurate comparison than responses alone
Analyze results at a segment level to identify where performance meets objectives and to guide future targeting
Supplement tracking with more robust modeling and analytics when insight is needed into the impact of multiple touch points

The second capability is marketing automation’s support for using market testing measures. This support involves creating matching treatment and control groups and generating results for direct marketing campaigns. The control group excludes a specific direct marketing tactic to measure the true incremental lift of that specific tactic. Market testing to comparable treatment and control groups will eliminate the influence of other marketing and non-marketing factors, providing a more reliable measurement than basic results tracking. Market testing can also be set up for assessing online media campaigns or online content using A/B splits. This approach is primarily used to test a “challenger” campaign against a “champion” campaign to assess the relative impact and requires a comparable control group to measure the incremental lift of the specific campaign within the broader marketing mix.

Actions to improve market testing measurements:

Set up market test measures to assess and identify higher-performing strategies; don’t be limited to only measures comparing tactics
Expand current measures beyond single tactics to assess contact strategies, contact frequency, or the integration of multiple tactics over time
Experiment with alternative strategies and tactics to accelerate improvements in effectiveness

Rich Data for Advanced Modeling & Analytics

A significant gap that creates a major measurement barrier for many companies is access to detailed marketing data. Marketing automation greatly reduces this barrier by serving as a repository for a good portion of marketing activity and responses. Marketing automation systems capture data on the marketing initiatives that are planned and executed through those systems, which tend to consist of direct response programs and online campaigns. These systems are also starting to capture social media activity, which enables better measurement of these emerging marketing channels.


When this data is combined with data for missing mass media marketing and offline marketing programs, modeling can be run to assess the marketing mix and identify performance drivers. Sophisticated modeling measurements can identify the sales contribution of each tactic within the overall marketing mix, eliminating the attribution of each sale to a single tactic that is used in results tracking.


Even without the addition of non-tracked marketing, there is plenty of rich data to support analytics assessing marketing performance. Modeling of tracked campaign data can include:

Lead Quality Analysis – Predictive modeling is used to project sales conversion rates and average customer value to assess the effectiveness of specific tactics to attract higher value and higher potential prospects. Measuring lead quality will lead to decisions that drive better marketing performance compared to relying only on lead quantity.
Multi-Touch Drivers & Synergies – Modeling to assess the relative contribution of tracked marketing campaigns on generating leads, opportunities or sales within a complex mix of multiple touch points. This analysis uncovers hidden marketing drivers that get missed when results are tracked to the first lead source or last contact. With this analysis, the incremental contribution of these tactics that would otherwise be missed can now be quantified.
Engagement Lift – Analytics are run on specific forms of buyer engagement such as educational programs or social media contacts to determine the incremental lift on sales outcomes. This analysis quantifying the impact of a non-purchase action helps marketers assess marketing initiatives aimed at motivating such forms of engagement.

Actions for better model measurements:

Capture weekly data on marketing activity and response for more precise modeling
Aggregate marketing data not managed through marketing automation for more complete modeling
Run modeling to eliminate the complexity of multi-touch marketing environments to better understand the effectiveness of current tactics
Use analytics with available data for deeper insights into specific aspects of marketing performance

Key Metrics & Performance Management

Marketing automation systems provide dashboards and other reporting capabilities to help track key metrics. Metrics can be tracked back to specific marketing initiatives or rolled up into a collective view. This functionality is a huge step forward in managing marketing performance and effectiveness. There are many valuable metrics and we’ll summarize what’s most important for guide marketing decisions and maximize ROI.

Recommendations to gain better insight from key metrics reporting:

Choose metrics that align well to ROI. Start with the primary drives of ROI, which include sales conversion rates (sales as percent of responses, leads, or opportunities), average profit per sale and average cost per sale.
Monitor purchase funnel progression metrics and analyze leakage points to determine where marketing improvement is needed to better influence purchase decisions.
Metric trends tell much more than the current value of a metric so monitor changes over time.
Use forecasting where possible to understand how changes in metrics today will influence financial outcomes in the periods that follow.

Innovation in marketing automation is moving at a very good pace. Marketers benefit from capabilities to better design and manage campaigns, as well as deriving better insights into marketing performance. Automation enables enhanced measurements and analytics so marketers can manage and improve effectiveness. Technologies will continue to capture more of the data that is so critical for advanced analytics to address the complex questions of marketing contribution. Marketers that use marketing automation as a resource for managing, measuring, and improving marketing effectiveness will certainly gain great advantages in achieving their goals.