Categories
Archived Research

2011 B2B Lead Generation Marketing ROI Study

Lenskold Article Series

by Jim Lenskold

2011 B2B Lead Generation Marketing ROI Study

One of our best research studies, this one dug deep into marketing metrics and automation as key components of the marketing ROI process.


  • Which key metrics are reported to senior management on marketing performance and financial contribution, which are used for forecasting, and which are used for the marketing organization’s compensation?
 
  • What impact does marketing automation have on marketing effectiveness and growth?
 
  • How does marketing ROI adoption influence marketing performance and growth among B2B lead generation marketers?
Note: There is also a Research Suplement on Marketing Automation that complements this report. The full report includes detailed findings and recommendations.  Select findings include:
  • Overall, most marketers (87%) report at least one marketing performance metric to senior management (average 43% per metric).  Three out of four (77%) forecast leads, opportunities, sales and/or revenue (average 41% per metric). Just 65% are reporting at least one financial metric related to marketing’s contribution to senior management (average 30% per metric).
  • Companies outgrowing their competitors are much more likely to report marketing contribution to senior management than companies with the same or slower growth, using the metrics Percent of Total Sales Contributed by Marketing (38% vs. 23%) and Percent of Total Revenue Contributed by Marketing (30% vs. 18%). These higher growth companies are also more likely to report Marketing-Generated Revenue to senior management (38% vs. 26%).
  • The top-tier of highly effective and efficient marketers calculate ROI or similar financial measures to assess their marketing effectiveness (62% vs. 23% of all other marketers) and are more likely to indicate they are experiencing much greater growth than their competitors (55% vs. 13% of all others).
Here are two highlight from the many great findings:

Fill Out the form to complete the download


By submitting this form, you are consenting to receive marketing emails from: Lenskold Group, 601 Bangs Avenue, Suite 504, Asbury Park, NJ, 07712, https://www.lenskold.com. You can revoke your consent to receive emails at any time by using the SafeUnsubscribe® link, found at the bottom of every email. Emails are serviced by Constant Contact

By submitting this form with the Subscribe button checked, you are granting: Lenskold Group, 601 Bangs Avenue, Suite 402, Asbury Park, New Jersey, 07712, United States, https://www.lenskold.com permission to email you. You may unsubscribe via the link found at the bottom of every email. (See our Email Privacy Policy for details.) Your e-mail will be kept private and only used for educational content from Lenskold Group as outlined in our Privacy Policy. By clicking on the link delivered via e-mail to download content, you consent to use of a cookie that will provide you access to all other content without completing the form again.

Categories
Recorded Webinars

How Marketers Win Friends and Keep Profitable Customers Through ROI Analysis

Lenskold Article Series

by Jim Lenskold

How Marketers Win Friends and Keep Profitable Customers Through ROI Analysis

Customer-centric metrics and measurements are essential for guiding profitable marketing strategies and tactics for both B2B and B2C companies. Learn how better analysis and planning help marketers more effectively retain profitable segments of customers. We’ll cover specific steps with marketing ROI techniques and analytics you can take to manage key profit drivers — such as targeting, customer longevity and vulnerability, the customer experience, referral value, and planning integrated marketing over the customer lifecycle — to deliver more profitable retention marketing.


To view webinar, you will be redirected to marketingprofs.com and will be prompted to sign in to view session. *Please note that fees may apply for non-premium members.


Click here to view webinar.


Categories
Recorded Webinars

Improving Lead Generation Marketing Effectiveness & ROI

Lenskold Article Series

by Jim Lenskold

Improving Lead Generation Marketing Effectiveness & ROI

Learn about best practices from highly effective and efficient organizations and the secrets behind higher growth companies as identified in the 2010 Lead Gen Marketing Effectiveness research study.

You can also read the complete 2010 Lead Generation Effectiveness Study.

Categories
Article Library rio resources

Monitor Long-Term Buying Behaviors When Growing Short-Term Sales

Lenskold Article Series

by Jim Lenskold

Monitor Long-Term Buying Behaviors When Growing Short-Term Sales

When you think of marketing metrics, it’s not likely that the customer experience immediately comes to mind. The warm and fuzzy stuff isn’t as easy to calculate as your typical marketing measurements. Yet leading CMOs will tell you that customer experience is key when building solid marketing measurements.


At Dow Corning, for instance, the marketing organization has done a terrific job implementing Six Sigma methodologies—the discipline of improving predictability and precision through structured measurements and processes—to drive marketing success. CMO Scott Fuson describes Dow’s “voice of the customer” as the cornerstone of its process, guiding the company’s marketing measurements toward clearly defined critical customer requirements.


Measurement of such key performance indicators supports sales and marketing in developing stronger customer loyalty and proactively addressing issues that negatively impact long-term customer profitability. The results have been significant in both shifting Dow’s culture and generating more than 20 times the financial returns on external spending.


I co-chaired a conference that featured more than a dozen CMOs from companies such as Hewlett-Packard, The Home Depot and Allstate. The topic: measuring marketing’s impact on the bottom line. As you would expect, these CMOs provided insight into their journeys toward greater profitability management. They talked about the difficulties in developing their measurement infrastructure and acknowledged the need for building accountability.


But the theme that was most prevalent—and least obvious in terms of relating to marketing measurements—was the importance of managing the customer experience.


When you think about it, how can you really manage marketing profitability without thinking about the customer experience? After all, for the vast number of companies, the real profits roll in not with new customer acquisition, but with repeat purchases from the most profitable customer segments.


Paul Koulogeorge, vice president of marketing at EB Games, an electronic game retailer with more than 2,000 stores worldwide, is attentive to customer experience numbers and knows that repeat business is critical to his company’s success. He tells a story of how the company occasionally receives letters from concerned parents complaining about how store employees had a Mohawk haircut, tattoos or “a bit of an attitude.” Koulogeorge describes his typical reaction to these letters as: “Great!”


“We hire raving fans and include free trials and midnight openings for new games to ensure the store experience is unique and completely focused on the young male audience who are avid gamers,” says Koulogeorge. “The in-store experience has to be centered on this core audience and entice them to return again, whether they make a purchase or not at that time.”

In the Pipeline

Funnel management is a major component of marketing profitability management. A customer funnel lays out the progression from unaware prospect to long-term customer; it is central to marketing measurement because it creates the link between marketing activities intended to motivate customer behaviors and the impact of those behaviors on financial outcomes for the company.


Allstate, HP and Siebel all include the customer funnel as part of their management of marketing measurement and the overall customer experience. CMO Joe Tripodi describes how Allstate’s marketing scorecard tracks customer progression through key milestones such as quote rates, close rates, cross-sales and renewals. His Balanced Scorecard broadens to include business results (quote volume generated, ROI), brand health (awareness, consideration) and customer experience (retention, customer loyalty, referrals). Given that Allstate’s advertising is intended to generate incremental business by building strong emotional bonds, measurements around the customer experience before and after the initial purchase are critical.


Think about it this way: Your marketing efforts through all of your touch points influence a select segment of customers to be more inclined to buy from you. At any point in the funnel, leakage can result from a single gap in the experience, such as a failure to communicate a critical piece of information, a disconnect in positioning, or delivery of products and services that fall below expectations. Leakage points represent lost profit opportunities. Your marketing measurements must be structured to uncover the leakage points in the funnel in order to guide new strategies, tighten integration across diverse marketing initiatives and motivate a common commitment to improving profitability.

Finding Your Inner Customer

The former CMO of a leading heating and air-conditioning equipment company told me that, shortly after joining the company, he recognized that the real opportunity for growing profits lay in taking ownership of the customer experience. His efforts to get the company to become more customer-centric, integrate sales and marketing, and manage the complete brand experience were largely driven by the work he did to establish the right metrics for the organization.


While there are many lessons to be learned from this CMO, I saw four key steps that really made the difference in his success. Initially, he took the approach of questioning the obvious. He came into a sales-driven organization where the primary business metrics were transaction-based and reflective, tracking products sold by region. There were no predictive metrics to indicate how current performance would affect future sales and no customer-based metrics to indicate who the top customers were.


On the surface, the current metrics indicated overall business performance was going well. To get a deeper understanding of the customer and sales process, he met with top sales executives, conducted customer focus groups and initiated customer satisfaction research. He discovered that the likelihood that recent customers would repurchase from his company was 50-50 at best, so he knew the current metrics were not telling the full story.


He then mapped out the customer experience with a close look at all touch points, including the sales process. The sales approach shifted from pushing products to selling customer-specific solutions. He also sought to move the company from being product-centered to being customer-centered. Such buy-in was significant, since the introduction of new metrics would mean a disruption in the current sales compensation plan.

The last critical step before initiating the transition was defining key metrics for the organization. Its core metrics were shifted to align with its customers’ success metrics.


A carefully constructed customer satisfaction measurement was designed to correlate with sales performance. Other customer-driven metrics included contribution to the customer’s speed to market, total cost of ownership and compliance with customer regulatory requirements. Common metrics were established across all sales and marketing groups. Now the company’s sales and marketing culture is attentive to not only customers’ satisfaction but also the satisfaction of its customers’ customers.

Analyze This

Consider what your current marketing metrics actually tell you in terms of the entire customer-funnel progression. If you are measuring awareness and consideration, do you look at your performance as a single metric across your broadly defined target audience? Or do you assess your position for noncustomers, new customers and loyal customers differently? The results for each group provide very different insight into your potential success.


And if you are running marketing mix modeling, are you content with the correlation between advertising spend and total sales volume? Or are you drilling down to uncover the underlying behavioral shifts by new customers, short-term shifts in buying patterns or sustainable shifts in loyalty? Are you completing the right research to identify how the customer experience influences future purchase decisions or leads to leakage from the funnel?


I encourage you to bring your analysis down to the customer level, whether it’s through mining your customer database, creating a new approach to modeling, running quantitative research studies or observing the actual customer experience. As you learn how your marketing influences the behaviors of prospects and customers over time, you’ll be better positioned to design future strategies and tactics and project the financial outcomes from those initiatives.


Copyright © 2005, CXO Media Inc., reprinted by permission from CMO Magazine.

Categories
Article Library rio resources

Make a Plan to Get More Out of Your Annual Planning and Budgeting

Lenskold Article Series

by Jim Lenskold

Make a Plan to Get More Out of Your Annual Planning and Budgeting

In our days of youth, we dreaded the end of summer and the return to school. Now, as marketing and business managers, we have the equally dreadful annual planning and budgeting process that for many starts toward the latter part of summer. CFO Magazine reports that almost half (45%) of financial executives say “budgeting and reporting are contentious, political, and time-consuming.” If the number-loving finance group has this view, you’re not likely to find marketers’ opinions to be any better.


Since planning and budgeting are not going away, you may as well make the effort to get more value out of the process. It’s actually an ideal time for putting basic ROI analysis to use. Here are four ways to use financial insight to create more profitable strategies and tactical plans while building greater credibility with your executive team.

1. Alignment with objectives sets the right stage

Alignment with business objectives and at least a reasonable financial estimate of your impact will enhance your credibility with Finance and the executive team who are determining where in the company to put their limited financial resources. The credibility from showing ROI and contribution to business growth puts marketing on equal footing with other departments, making it more of an investment than a discretionary expense.


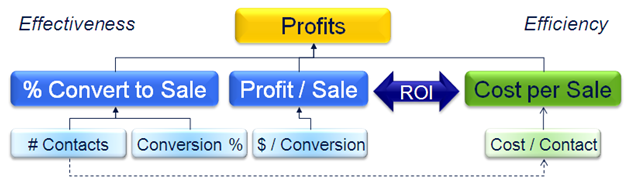
Start by using the best information available to map the impact of your marketing on customer perceptions and behaviors completely through to financial outcomes. Not every marketing initiative directly drives incremental sales, so look beyond this independent initiative and consider how this integrates with other initiatives. It’s helpful to consider the customers’ buying funnel that represents the progression from unaware prospect to profitable customer.


Your plan should state both what your marketing accomplishes on its own and specifically how that contributes to business performance. If you are not sure how your marketing contributes, you quite likely have gaps in your strategies and plans.


Getting an estimated ROI projection from this point can be done two ways:


  1. The first approach is to compare the cost of your marketing initiative (your investment) to the incremental financial contribution (the profit directly from your initiative or in excess of the profit that would have been contributed without your marketing initiative).
  2. The second approach is to sum your initiative and the ones that follow (where sales are actually generated) to compare that total investment to the total profits returned.

Yes, there are lots of details to getting these figures precisely right, but running an estimated projection is the start to understanding your profit potential.

2. ROI scenarios lead to better profitability

Even if you are working without perfect information, you should be able to at least assess the relative value of your marketing initiatives to improve each, and then prioritize for budget allocation. Run ROI scenarios to understand how changes to your target, marketing mix, offers, integration, and general investment levels change the profit potential.


Be sure to put most of your effort into prioritizing your target market segments, since targeting almost always has the greatest influence on ROI. You need to concentrate your efforts on not only high-value customers but also high-potential customers—the ones you can cost effectively motivate to choose your products and services.


The final budget allocation needs to reflect the business objectives for balancing short-term and long-term results. It should also have an appropriate mix of proven marketing initiatives (low risk) and new initiatives that are innovative and high potential (high risk).


Some 72% percent of the financial executives surveyed by CFO Research Services say that “planning and budgeting information is unrealistic or irrelevant,” either frequently (27%) or occasionally (45%). Of course, marketing always has unknowns, such as customer response, marketing effectiveness, and competitive activity, but smart marketers will make their estimates as realistic as possible. You’ll use the best assumptions you can, maybe tapping further into historical data or custom research.


The more your ROI analysis can represent your expectations of marketing performance, the easier it will be to refine those assumptions and adjust your marketing decisions. Plus, the exercise to estimate the financial outcomes of your marketing investments will help identify information gaps, leading to the next action item presented in this article.

3. Better insight today makes for better decisions tomorrow

One of the reasons the planning process is so painful is that there is rarely enough quality research and analysis to make informed decisions. Instead of finding yourself in that same position again next year, incorporate greater learning into the plan you are developing.


Granted, it’s not easy to pull budget from revenue-producing marketing activities to fund measurements and analysis. What you have to consider is that (1) the value of some marketing initiatives is already questionable; (2) in most cases the insight gained will pay back with more effective marketing in the current or following year; and (3) plenty of new insights can be gained with little or no incremental budget if you take the time to plan right.

4. Use the right metrics in the right way

Finally, you want your success metrics to be aligned with business objectives as well. There are a lot of dynamics involved in properly setting goals and objectives, and we’re only going to touch on one key point here. The marketing organization as a whole must reach the point where the primary goals contribute to the business objectives of profits and growth (both short term and long term).


Performance metrics, such as awareness, audience reach, advertising recall, and even leads generated, are critical for knowing whether you are on track to deliver on those goals. But be careful not to let performance metrics become your goals. Keep in mind that executives feel less pain when they cut budgets that have no clear connection to business objectives.


Conclusion


The planning and budgeting process apparently brings out the worst in us. Over half (53%) of the financial executives surveyed by CFO Research Services say the budgeting process “encourages undesirable behaviors among managers.”


Besides the gaps in data, performance measurements, and analyses that limit the accuracy of annual marketing plans and forecasts, there are also corporate culture issues that come into play. Executives engage in wishful thinking and push managers to deliver more results with less budget, while managers seek to under-commit and over-perform, especially where bonuses are dependent on the final plan.

For now, let’s focus on using quality ROI analytics to improve both our accuracy and our credibility. Let’s also try to act on our best behavior.

Categories
Article Library rio resources

Challenges and Opportunities for Marketing ROI

Lenskold Article Series

by Jim Lenskold

Challenges and Opportunities for Marketing ROI

I have delivered 2-day Marketing ROI Techniques workshops to over 2,900 marketing professionals in 13 countries. The interactive sessions are designed to educate marketing professionals on how to bring marketing ROI principles into campaign strategies, planning and measures while also identifying the challenges and barriers that must be addressed to make improvements.


One might think that the greatest challenges would center on the accessibility of customer and financial information or measurability issues. There were cases where these barriers applied, however the most prevalent and significant barriers stemmed from the corporate culture, mindset and organizational structure. Consider just a few of these types of barriers:


  • Resistance to change from existing performance goals originally set based on what could be measured instead of measures that are in aligned with what needs to be accomplished.
  • Insufficient resources and budget for market testing, analytics, or research to bring the intelligence necessary to drive more profitable performance.
  • The lack of cooperation between marketing and sales to create a cohesive and measurable approach covering the entire sales cycle.
  • Intentionally restricting access to customer information to within business unit “silos” to maintain control and advantages over other business units.

At the same time the workshop participants were identifying challenges, they were also recognizing the significant financial benefits that could be achieved with a more disciplined approach and greater insight into marketing ROI. Companies benefit from the increased understanding of key profit drivers and the framework to guide investments into the right strategies and tactical executions. 


Those companies that are investing time, effort and budget into advancing their marketing profitability and focus on the most profitable customers are creating a competitive advantage in an area where precision has great payback. It’s time for executives and marketers to remove the organizational barriers and take some bold moves toward achieve high performance marketing.

Categories
Article Library rio resources

A Well-Oiled Machine: How Measurements Improve the Marketing Process

Lenskold Article Series

by Jim Lenskold

A Well-Oiled Machine: How Measurements Improve the Marketing Process

Many of us are looking for the perfect way to measure advertising’s effectiveness and specific results. Unfortunately, no Holy Grail exists. The marketing environment is complex, and a mix of different research initiatives is required to truly tell us how well we are performing and where improvements are necessary. Measurements are a critical part of the marketing process, but in most companies, marketing falls far short of its potential by not tapping into the proven or emerging methodologies available.


What is it that makes marketing measurements so challenging? Well, in order to demonstrate the impact of your marketing programs, you need to measure the customer and sales activity that follows those initiatives and compare it with the activity that would have happened without them. The difference is the incremental impact of your efforts.


Sounds simple, perhaps, but how do you know what would have happened without your marketing, given that your company and competitors have other sales and marketing initiatives running at the same time?


I met a CMO who explained to me how he tracks sales activity prior to the marketing campaign and compares it with sales activity during and after the campaign. When there is a positive increase in sales, he attributes the lift to marketing. When sales decrease, he attributes it to external factors in the market. In reality, the sales levels are constantly fluctuating, so the measurements are far from valid regardless.

As amusing as his approach sounds, this was actually how the company made its decisions—and I’ve heard another dozen people repeat the same story.


One of the best measurement tools I’ve found for isolating the impact of marketing initiatives is market testing, or experimental design: using test and control groups. The control group (from which a portion of the marketing is withheld) represents what would have happened in the absence of that marketing component. The approach can be used to measure the effectiveness of an entire campaign, the incremental value of one marketing channel within a campaign mix, or the impact of increasing ad spending over the existing level.


Marketing mix modeling can also be used to establish the correlations between marketing and sales activity. The analysis shows which portion of previous sales activity can be attributed to each of the various marketing initiatives. The portion of activity that does not correlate to any marketing is considered the base activity that would be present without any marketing. This methodology does not require a control group and can be run on historical data. Its key limitations, however, include the inability to measure the impact of smaller initiatives and that it provides limited diagnostic analysis to understand exactly what is driving the sales activity.


I’ve been a major skeptic when it comes to using quantitative survey research as a primary source for assessing the impact of marketing on actual sales outcomes. Survey research is an excellent source of understanding customer perceptions and attitudes, but it is hard to trust self-reported purchase behaviors and the correlation to marketing activity. Recently, however, I’ve been converted after seeing an innovative measurement methodology that integrates modeling with quantitative research.

Establishing Links

The use of survey research by a major consumer products company probably wouldn’t surprise you, but what if I told you that a leading defense and aerospace supplier uses survey research to measure ad effectiveness? Raytheon sells primarily to the Department of Defense and other government agencies, but it launched a new corporate ad campaign in 2003 and used just such a methodology—one created by the Brand and Analytics Group of Phoenix Marketing International (formerly Cambridge Brand Analytics)—to measure its ad performance.


Phoenix’s unique methodology consists of conducting surveys with decision-makers in Raytheon’s industry, where impact on purchase consideration is linked back to specific ads by Raytheon and its competitors.


In other industries, the Phoenix research will establish a link directly to sales or customer response activities. In Raytheon’s case, the link to purchase consideration is considered the best match to the corporate communications objectives that are centered on helping their customers succeed in their “warfighters” mission.


Lucy Flynn, director of brand and marketing communications at Raytheon, relies on the Phoenix analysis for quantitative results when reporting to the executive team. “Our analysis provides the rationale for shifting corporate positioning to align with the priorities of our clients,” she says, “and the hard data allows us to make solid strategic decisions with confidence.”


By gaining insight into the performance of each specific ad extending across all forms of media, the communications team at Raytheon has been able to improve its effectiveness by determining the positioning and messaging that best differentiates the organization’s ability to support the mission of its customers—and ultimately the mission of the men and women in uniform. That has helped the company refine campaign strategies, reallocate dollars into more effective ad executions and create new executions.


Raytheon also gets a read on its public relations impact. By incorporating PR articles into the Phoenix research, the company can confirm a respondent’s prior exposure to the articles and derive its impact on image and reputation, which helps to guide the PR strategy.

“If we aren’t getting the right message to our audience, we know it’s better to adjust our plan than to continue with the current ad spending,” says Flynn. And, as Flynn reminds us, “the worst way to measure is to not measure at all.”

The Innovative Methodology

Using a combination of Internet, mail and telephone research, Phoenix’s research participants are presented with actual ads and marketing communications for all major competitors in the category. That eliminates questions as to the validity of ad recall based strictly on verbal or written descriptions, and large sample sizes provide the necessary statistical validity.


Add sophisticated modeling to all that and you get a predictive and diagnostic tool for marketing measurement. Whether the research is modeled against a response step in the marketing process, purchase intentions, self-reported sales activity or even actual sales activity, the analysis establishes correlations to the survey data that have proven to be quite accurate.


The strategic value of this methodology is really in the diagnostics. The analysis identifies the performance of each specific ad, as well as competitors’ ads, in terms of breakthrough and recall, message relevance and persuasiveness—all critical components of effectively influencing customer behaviors. Marketers get a clear picture of where barriers and opportunities exist in terms of media plans, message and creative execution.


In the end, however, effective marketing performance management requires a plan that integrates multiple methodologies. Running controlled market tests in conjunction with the Phoenix research will deliver precise incremental sales results backed with clear analysis about where campaigns are effective at influencing awareness, perceptions, competitive differentiation, intentions and actions, and where campaign modifications can make the greatest impact.


Company executives are increasingly putting pressure on CMOs to demonstrate their contribution to the bottom line. Marketers need to understand the measurement tools that are at their disposal and put them to use.


Marketing measurements require a commitment of budget and staff resources, adequate time to complete measurements prior to major strategic decisions that are dependent on the insight, and a culture of using continuous analytics and insight as a competitive advantage. The path to better measurements seems clouded by many challenges, but once you move forward, the clarity from increased insight and knowledge will prove to be quite rewarding.


Copyright © 2005, CXO Media Inc., reprinted by permission from CMO Magazine.

Categories
Article Library rio resources

Maximizing Lead Generation Marketing ROI Part 4: Dashboard Metrics

Lenskold Article Series

by Jim Lenskold

Maximizing Lead Generation Marketing ROI Part 4: Dashboard Metrics

This is the fourth article in the four-part series on Maximizing Lead Generation Marketing ROI. The other articles in this series include:

Part 1: Lead Quality Counts
Part 2: Insight, Alignment & Action
Part 3: Measuring Effectiveness

In addition to measurements for specific tactics, which we covered in Part 3 of this 4-part series, marketing executives must be attentive to overall performance management. This involves monitoring and measuring key metrics to understand the collective impact of all marketing and sales efforts, to ensure business goals can be met, and to support business decisions.

The objective of our dashboard metrics is not reporting as much as capturing insight that can be used to improve performance. You want to select and define a set of metrics that 1) collectively reflects what is driving financial performance, 2) shows early indicators of future performance and 3) identifies specific areas of weakness where improvements can be beneficial. In this article, I’ll define 17 metrics specifically for lead generation marketing, which you can consider as you develop your performance management dashboard.

Framework for Key Metrics

Lead generation marketing plays the critical role of surfacing and engaging potential buyers to provide new and better prospects for the sales organization. For lead generation, key metrics must provide insight into lead quantity, lead quality, lead outcomes, and cost management. In addition to managing total leads to ensure business goals are met, the most critical metrics are those that assess marketing effectiveness in contributing to the primary profit drivers for the business, which include, 1) sales conversion rate, 2) incremental profit per customer, and 3) the cost per sale (see diagram below).

Lead Generation metrics can be organized into the following categories:


  • Funnel progression metrics – covering conversion rates from initial contact through closed sale
  • Customer value metrics – covering the financial value that results from the leads generated
  • Cost management metrics – covering the expense side
  • Goal attainment metrics – ensuring quantity and quality come together to meet business objectives

Funnel Progression Metrics

We can break funnel progression metrics into the following four sub-categories that provide insight into conversion quality:


  • New Leads
  • Sales Acceptance
  • Sales Readiness
  • Purchase Velocity

For each of these, we have a number of key metrics to consider.

New Leads

This first set of metrics is used to assess marketing effectiveness in terms of generating the right number and the right type of leads.

Marketing Qualified Lead Rate combines several stages in the funnel to incorporate a quality component into the marketing effectiveness assessment. This metric looks at the number of marketing qualified leads (MQLs) that are generated from all marketing contacts. This ratio improves as your marketing initiatives become more effective at generating more qualified leads, or more efficient at screening out low potential contacts.


Marketing Qualified Lead Rate = # of MQLs / # of total marketing contacts

Example – Direct marketing campaign promoting Webinar
10,000 contacts reached
800 Webinar participants
200 marketing qualified leads

Marketing Qualified Lead Rate = 200 / 10,000 = 2%

As an alternative, you can split the marketing qualified lead conversion metric into two metrics. This will provide more detail but the metrics must be used with caution, since improvements to the single metric may not align to improved business results. You will see that the two examples below match up to the example above.


Engagement Rate, in some cases referred to as a response rate, indicates how well Marketing generates some form of action from its targeted contacts. It is focused more on lead quantity than lead quality. Some marketing programs will generate fewer, high quality leads while others will attract a high response among lower quality of leads. This metric can be used to diagnose problem areas or compare how different marketing programs can be used in the marketing mix but is a low priority metric in terms of managing lead quality and goal attainment.

Engagement Rate = # of contacts taking action / # of marketing contacts

Example – Direct marketing campaign promoting Webinar
10,000 contacts reached
800 Webinar participants

Engagement Rate = 800 / 10,000 = 8%

Lead Qualification Rate is used with the engagement rate metric to determine how many of the “engaged” contacts qualify for Marketing to hand off to Sales. This screening step is not always included as a marketing responsibility, however, as we have noted in the first three articles of this series, it is a step that significantly impacts marketing profitability.

Lead Qualification Rate = # of marketing qualified leads (MQLs) / # of leads generated

Example – Webinar participants qualified via marketing screening process
800 Webinar participants
200 marketing qualified leads

Lead Qualification Rate = 200 / 800 = 25%

Sales Acceptance

Sales acceptance of marketing-generated leads is the next critical step in the process. If Sales is rejecting or even ignoring marketing leads, the marketing budget is not likely to be generating good ROI. The definitions for marketing qualified lead screening should align to the requirements for sales qualified leads (although not as strict).

Sales Acceptance Rate is one of the best indicators of lead quality, and could easily be labeled as the “Lead Quality” metric. It is the ratio of sales qualified leads to marketing qualified leads. It serves as an excellent indicator of how well Marketing is qualifying and screening leads to maintain high quality levels. A good target to aim for is 70% – 80% MQL to SQL.

Sales Acceptance Rate = # of Sales Qualified Leads (SQLs) / # of MQLs

Example – Marketing qualified leads from Webinar passed to Sales
200 MQLs passed to Sales
120 leads accepted as SQLs

Sales Acceptance Rate = 120 / 200 = 60%

Opportunity Rate tracks lead quality at a more precise level than the Sales Acceptance or Marketing Qualified Lead Rate metrics. Opportunities are typically defined by the Sales organization as leads that have clearly defined needs, purchasing authority, an expectation to purchase within a reasonable time period, and budget. This metric is assessing Marketing’s ability to generate leads that are generally ready to buy. It is based on the percent of leads generated converting to an opportunity.

Opportunity Rate = # of Opportunities / # of MQLs

Example – Marketing qualified leads passed to Sales and qualified as opportunities
200 MQLs passed to Sales
80 leads converting to Opportunities

Opportunity Rate = 80 / 200 = 40%

You can substitute number of leads generated in place of the number of MQLs passed to Sales if that works better for your organization.

Sales Pipeline Metrics


Too often, Marketing does not have system access to track their leads through the sales pipeline. As we have established in the first three articles of this series, Marketing must have insight into and contribute to influencing prospects at all stages of the purchase funnel. Marketing can have a significant role in creating “sales readiness,” especially in those firms making the argument to invest in branding to create stronger differentiation, and the best measures to understand the impact of those efforts are in the conversion rates within the sales funnel. The other significant benefit in tracking sales conversion rates is to understand sales effectiveness and where additional marketing support can improve the net sales rate (remember from Part 1 that improving conversion rates late in the purchase funnel has high ROI potential).

Opportunity to Close Rate summarizes the overall sales pipeline performance from the point of identifying a viable buyer to winning the sale. This can be further split into conversion rates for each major stage in the pipeline (such as opportunity to meeting, meeting to proposal, proposal to close) to provide more detail, but these two points work fairly well in representing the area that Sales manages. This detail is extremely valuable in diagnosing weak areas in the sales cycle.

Opportunity to Close Rate = # of Closed Sales / # of Opportunities

Lead to Close Rate (or Lead to Purchase Rate) captures the net outcome of the leads generated. This assesses how many leads passed to sales (MQLs) convert into sales.

Lead to Close Rate = # of Closed Sales / # of MQLs

Sales Capacity (or # of Leads per Rep) is also a good indicator of sales performance. This is the number of active leads managed divided by the number of sales people managing those leads. There is a point where the number of active leads begins to hurt sales effectiveness and this metric should show when that point is reached.

Sales Capacity = # of Active Leads / # Sales Reps

Purchase Velocity

Monitoring the pace of leads moving through the sales cycle provides additional insight that is often missed. There are two high priority metrics in this category.

Lead Contact Velocity is the average number of days between leads being handed off to Sales and Sales making initial contact (or contact attempts). It is an excellent indicator of sales capacity and can help in understanding why lead quality might mistakenly be viewed as declining. We had a client who could not determine why fewer and fewer leads were converting to opportunities, only to discover that the average days for the first contact had changed from 3 days to 14 days.

Lead Contact Velocity = Average # of Days from lead passed to lead contact

Lead to Close Velocity, also referred to as the sales cycle time, is the average number of days between a lead being handed off to Sales, and the closed sale date. As the sales cycle duration increases, it increases the cost to the sales organization, increases the number of active leads that need to be managed, and typically means a lower sales conversion rate. This metric lets the marketing organization know if additional effort needs to be put against sales readiness, or if additional tactics are necessary within the sales pipeline.

Lead to Close Velocity = Average # of Days from lead passed to closed sale

Customer Value Metrics

In addition to conversion rates, the other component of lead quality is customer value. By “value,” we are referring to the incremental profits generated from new customers and/or new sales. While revenue and sales volume are important, we must get to profits if we are going to assess ROI and ensure that our marketing programs generated more than we spent.


Customer value metrics help the marketing organization 1) improve targeting, 2) improve effectiveness in attracting higher value leads, and 3) improve customer purchase decisions to buy more or buy higher value products and services.

Average Profit per Customer should consist of the net present value of incremental customer profits generated as a result of this campaign. It encompasses the current purchase and the repeat purchases likely to follow (without additional investment in up-selling and cross-selling). This metric could easily be modified to alternatives such as Average Profit per Sale (if buyers are not known or tracked), or Average Profit per First Time Buyer.


Average Profit per Customer = total incremental profits / # of customers buying

Other metrics that reflect specific portions of customer value include Retention Rate (or Repeat Purchase Rate), Average Profit per Order, and Average Orders per Year (or any other time period).

Cost Management Metrics

You want to be careful with cost metrics since any positive changes to conversion rates or customer value can easily justify increased costs. However, you do want to look for opportunities to generate the same lead quality with less expense.


The three cost management metrics that each show a slightly different perspective are
Cost per MQL, Cost per Opportunity, and Cost per Sale.

Cost per MQL (or Cost per Lead if you do not have a qualification stage) provides a very narrow, marketing-only perspective that ends with the marketing leads. It is okay but not ideal.

Cost per MQL = Total Marketing Cost / # of MQLs generated

Cost per Opportunity is probably the best metric for lead generation marketing since it sets the objective that leads should be screened and nurtured properly and ready for the sales cycle.

Cost per Opportunity = Total Marketing Cost / # of Opportunities from MQLs

Cost per Sale is another excellent metric which provides an integrated Marketing and Sales perspective. This includes both the marketing and sales expense so it motivates Marketing to provide fewer, better leads.

Cost per Sale = Total Marketing & Sales Cost for a set of leads / # of closes sales from the same set of leads

Goal Attainment Metrics

All of the metrics so far provide insight into your effectiveness and lead quality, but it is possible to improve quality and then not have enough leads to reach your goals. This last set of metrics helps ensure that you (Marketing and Sales together) are on track to meet the financial objectives of the company.

Number of Active Leads per Period lets the marketing organization know if there are enough leads to reach the sales goals for upcoming periods. This metric can indicate a sales capacity issue when too high, letting Marketing know to reduce new leads. You could use the metric Lead Volume per Period, which represents the total number of new leads that Marketing delivers to Sales, but that does not take into consideration sales capacity and does not ensure there are enough leads in the pipeline to generate the right number of sales.


Number of Active Opportunities per Period is an alternate version that will be more predictive of future sales volumes. For either metrics, the sales organization should know how many active leads or opportunities are necessary to meet closed sales goals. This is determined by using your target number of closed sales and your conversion rate. For example, if your Opportunity to Close Rate is 10% and your target sales for each month is 20, then at any given time, the sales organization needs to have 200 active opportunities. This is calculated by dividing the sales goal by the conversion rate (20 / 10% = 200). The time period is not relevant as long as the Lead to Close Velocity remains steady.


Projected Profit per Active Opportunity is the ideal metric to monitor the financial value of the pipeline. It is used in conjunction with the Number of Active Opportunities per Period and the Opportunity to Close Rate to forecast the future flow of profits from new sales. Realistically, this is more often tracked as projected revenue per opportunity. While revenue does not show the true relative value of different opportunities, it tends to fit the sales management process well.


Total Sales Volume per Period is an important outcome metric that is used with the Average Profit per Customer to manage the financial performance from new sales.

Metrics Selection

We’ve covered a good set of metrics in several categories to monitor and manage overall lead generation performance. These metrics extend into the sales pipeline, which is required to truly manage the marketing impact on business outcomes, so work must be done to set up access and tracking.


Your primary metrics should be as comprehensive as possible in covering lead quality (conversion rates and customer value), cost management, and goal attainment (lead quantity). Each marketing organization will have a unique set of metrics. Your final set of metrics will be determined by:


  • The availability of the right data to track lead outcomes, including the sales pipeline
  • The quality of tracking data since you need to avoid using data that will report inaccurate metrics
  • The customer relationship, since the detail of tracking data is dependent on your ability to know progression through the funnel stages
  • Your decision process, since your dashboard and metrics should be defined based on how the marketing organization makes decisions to manage their performance.

This concludes our 4-part series on Lead Generation ROI. There is clearly a significant opportunity to improve the ROI of lead generation marketing with better measurement and management processes. Whether it is better alignment with sales, better metrics, or leveraging new insights to guide marketing strategies and tactical decisions, every step forward will result in improved marketing performance and profitability.


Return to Part 1: Lead Quality Counts >>

Categories
Article Library rio resources

2008 Survey Shows Better Data, Measurement Abilities, and ROI Metrics Boost Marketing Performance

Lenskold Article Series

by Jim Lenskold

2008 Survey Shows Better Data, Measurement Abilities, and ROI Metrics Boost Marketing Performance

Want to take your performance to that ideal level of highly effective and efficient marketing? It takes better access to detailed data and ROI discipline but it also comes along with greater growth and better levels of budgets, according to the Lenskold Group / Kneebone 2008 Marketing ROI and Measurements Study.

The study, conducted with 834 MarketingProfs members in April 2008, found that most marketers (75%) are making progress in diverse areas of marketing ROI and measurement capabilities, but many continue to struggle with some basic measurements that are required to manage and improve marketing’s contribution to business objectives. Overall, more marketers rated their measurement abilities as negative than positive as shown in Figure 1. The ability to measure the incremental impact of marketing and to diagnose performance gaps are particularly important to provide critical insight that can guide performance improvements.

Figure 1

Marketers who described their marketing as highly effective and efficient (just 9% of all marketers surveyed), showed better measurement and ROI practices, indicating that they are making marketing decisions with better insight. These high performers are:

  1. Much stronger in their measurement abilities (see Figure 2)
  2. Gaining access to critical data for analysis (see Figure 3)
  3. Much more likely to use ROI and profitability metrics to assess their marketing performance (see Figure 4)

These characteristics are helping companies to secure the right level of marketing budget to achieve their goals and to outgrow their competitors.

Measurement Abilities

Companies with highly effective and efficient marketing show much greater levels of measurement abilities, with roughly half to three-quarters providing positive ratings on their abilities – which is two to three times the levels reported from the overall base of marketers (see Figure 2). The ability to assess marketing performance and optimize the allocation of their marketing budget clearly enables these companies to manage and deliver more effective and efficient marketing.

Figure 2

Access to Data for Analyses

What critical information would you think marketing has the most difficult time getting for analysis? Maybe financial or sales data? Believe it or not, the greatest challenge is getting information that is generally controlled by the marketing organization. As shown in Figure 4, the lowest ratings on the ability to access information were for marketing spend data, promotion/contact history, and response/lead data. While marketers typically manage this information, the real challenge is the ability to get detailed information that is consolidated and available for analysis.

Looking at the same chart, you can also see that companies with highly effective and efficient marketing show no gaps in these same areas of data access, suggesting an advantage over other companies. There is clearly a need for marketing organizations to step up their level of automation to capture this critical data, apply analyses, and drive higher performance.

Figure 3

Marketing ROI and Profitability Metrics

There is a strong correlation between marketing effectiveness and efficiency and the use of marketing ROI and profitability metrics to assess marketing performance. When looking at how users of marketing ROI metrics describe their effectiveness and efficiency, a combined 79% indicate they are highly or somewhat effective and efficient (vs. 42% of those using just traditional, non-financial marketing metrics) and 19% indicate they are highly effective and efficient (vs. 3% of those using just traditional marketing metrics). Just 19% of ROI metrics users reported that their marketing was not efficient compared to 50% of those using traditional metrics. Effectiveness can be judged in many ways but to achieve success in both effectiveness and efficiency clearly requires the use of financial metrics such as ROI.

Figure 3

Greater Growth and Sufficient Budgets

In addition to having higher effectiveness and efficiency, companies using marketing ROI and profitability metrics are more likely to be outgrowing their competitors (64% vs. 47% of those using traditional marketing metrics.


More then half (52%) of the general base of marketers report that their budget is below the level necessary to achieve their goals. But as you might expect, those companies with highly effective and efficient marketing – who are also more likely to use ROI and profitability metrics, have better access to data, and have better measurement abilities – indicate they have sufficient or higher budgets available (63% vs. 39% overall).


The challenge is making your case to get the resources and support for better data access, measurements, and metrics. It is clear that better insight increases marketing and business performance. And it is obvious that better measurements of marketing impact and contribution will improve credibility and help secure better budgets. But breaking the barriers of existing practices is not easy. It takes leadership with a commitment to the discipline of measurements and ROI to take the first step of investing to get actionable insight and then using the success in performance improvements to make a lasting shift the culture and practices of the marketing organization.


The 2008 Marketing ROI and Measurements research report offers more findings, additional detail, and recommendations. The report is available for download: 2008 Marketing ROI and Measurements Study.

Categories
Article Library rio resources

Justifying the ROI on Intelligence

Lenskold Article Series

by Jim Lenskold

Justifying the ROI on Intelligence

Customer intelligence can be extremely valuable in driving marketing performance, when effectively applied. The problem many marketing organizations face is getting support and budget to capture the intelligence. With a clear vision for profitably converting intelligence into actionable insight, you should be positioned for justifying such investments that generate a clear ROI. Here are five steps to help organize your justification along with a perspective on the type of intelligence most likely to improve your marketing profitability.

1. Define the Intelligence Needed

Whether the objective is retention, acquisition, winback or cross-selling, the most significant profit driver for marketing always comes down to targeting. Insight that guides targeting toward customers with higher value and a higher likelihood to purchase offers the greatest return potential. When you consider capturing intelligence, don’t limit your thinking to just customer intelligence. Insight into effectiveness measurements, research, data analysis, and modeling must also be considered as intelligence that contributes to better decisions.


Potential Value


  • Customer needs indicate what they are likely to purchase and their preferences indicate how they like to buy
  • Share of customer indicates the potential profits that can be won from the competition
  • Customer transaction history indicates trends in value and can also be used to model future value based on customer behavior patterns
  • Customer demographics allow segmentation based on profiles of past high value customers


Likelihood to Purchase & Stay

 
  • Modeling and profiling identify customer segments most likely to purchase as well as those most likely to be retained
  • Competitive relationship information collected through customer contacts identifies competitors’ vulnerable and loyal segments


Marketing Effectiveness

 
  • Historical performance analysis guides the development of strategies and tactics
  • Campaign ROI brings financial intelligence into the decision process
  • Marketing mix modeling optimizes integrated campaign channels
  • Brand attribute research establishes the connection to actual purchase behaviors so brand initiatives can be tied to sales contribution

2. Assess Sources of Intelligence

You must now categorize each source for the data and intelligence needed as 1) existing, 2) accessible, 3) desirable or 4) impossible. The “existing” and “accessible” sources should require minimal effort and cost. The “impossible” sources are those not likely to happen. Therefore you will focus your justification analysis on the “desirable” sources, which can improve your profitability but will require some effort and investment to implement.


Sources of data and intelligence that should be considered:
 
  • Existing customer data from financial, sales, marketing, and customer contact systems. If this is not already cleaned and consolidated, it will be necessary to look closely at data integrity and quality issues.
  • Third party customer data to append to your files.
  • Touchpoint opportunities where you can capture specific information from customers and prospects.
  • Marketing communications history.
  • Marketing interactions including customer response, involvement, and inquiry information.
  • Marketing spend and results history for effectiveness measures.
  • Customer research to build profiles of customer behavior patterns, value patterns, and needs.
  • Predictive modeling analysis to correlate marketing activities, brand attributes, targeting, offers, and channel mix to sales performance and lifetime value.

3. Identify Highest Profit Potential

Your investment to build greater intelligence may be a one-time initiative to capture insight for a specific purpose or a permanent change in the process or infrastructure of collecting intelligence. Preparing an estimate of the expense requirements is relatively easy. The challenge is estimating the potential impact on profits. By starting the process with a focus on improving the key drivers of marketing profitability, your analysis includes the value component.


For example, identifying your share of customer spend through call center and online contacts may have a significant impact on the 15% of the customers where information actually gets captured. This might be compared to a potential research study to understand which customer acquisition channels bring in customers with the highest retention rates or a modeling initiative that identifies which marketing channels are most effective.


You must determine what forms of intelligence can have the greatest impact on your ability to win more high value customers, reduce wasted marketing to unresponsive and unprofitable customer segments, and provide insight into marketing effectiveness. The ROI analysis provides a comparison based on the estimated returns for each intelligence initiative. To win the support of your CFO or senior executives, your business case must be based on generating incremental profits and cannot rely on non-financial metrics such as improved satisfaction or relationships. Assess your marketing impact through the entire sales and relationship cycle to determine the financial contribution.

4. Prioritize Investment Opportunities and Gain Support

Once you have completed your ROI analysis and prioritized the intelligence that offers the highest value, it is time to pitch the concept to the decision makers. Seeking additional budget is never easy. You’ll either have a compelling business case that justifies the increased funding or you will need to reallocate existing budgets. Some marketing executives incorporate research and intelligence collection into their campaign budgets so, for example, 10% – 15% of a campaign budget will be dedicated to capturing the intelligence necessary to improve future campaigns.

5. Test, Validate and Refine Profit Potential

Some initiatives may be first funded on a trial basis to validate the assumed impact of intelligence on profitability. For all funded initiatives, it is important to validate assumptions and focus on continuous improvement. The amount of intelligence that can be collected is endless so 1) make sure you continue to drill down to improve your decision-making precision and accuracy and 2) make sure you focus on the intelligence that has the greatest impact on results so you are not overburdened with excess information.


It is important to recognize that intelligence can be a significant competitive advantage when applied as insight into your strategies. Improving marketing profitability helps your marketing budget go further and deliver a greater share of customer profits while competitors continue to be misdirected by sales volume and share of revenue.


The original version of this article was published by CRM Today.