Categories
Article Library rio resources

Maximizing Lead Generation Marketing ROI Part 4: Dashboard Metrics

Lenskold Article Series

by Jim Lenskold

Maximizing Lead Generation Marketing ROI Part 4: Dashboard Metrics

This is the fourth article in the four-part series on Maximizing Lead Generation Marketing ROI. The other articles in this series include:

Part 1: Lead Quality Counts
Part 2: Insight, Alignment & Action
Part 3: Measuring Effectiveness

In addition to measurements for specific tactics, which we covered in Part 3 of this 4-part series, marketing executives must be attentive to overall performance management. This involves monitoring and measuring key metrics to understand the collective impact of all marketing and sales efforts, to ensure business goals can be met, and to support business decisions.

The objective of our dashboard metrics is not reporting as much as capturing insight that can be used to improve performance. You want to select and define a set of metrics that 1) collectively reflects what is driving financial performance, 2) shows early indicators of future performance and 3) identifies specific areas of weakness where improvements can be beneficial. In this article, I’ll define 17 metrics specifically for lead generation marketing, which you can consider as you develop your performance management dashboard.

Framework for Key Metrics

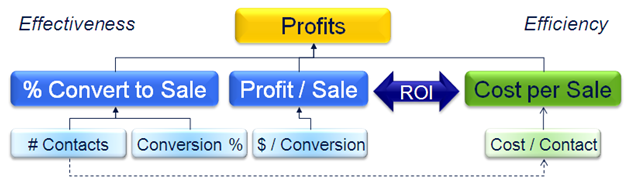
Lead generation marketing plays the critical role of surfacing and engaging potential buyers to provide new and better prospects for the sales organization. For lead generation, key metrics must provide insight into lead quantity, lead quality, lead outcomes, and cost management. In addition to managing total leads to ensure business goals are met, the most critical metrics are those that assess marketing effectiveness in contributing to the primary profit drivers for the business, which include, 1) sales conversion rate, 2) incremental profit per customer, and 3) the cost per sale (see diagram below).

Lead Generation metrics can be organized into the following categories:


  • Funnel progression metrics – covering conversion rates from initial contact through closed sale
  • Customer value metrics – covering the financial value that results from the leads generated
  • Cost management metrics – covering the expense side
  • Goal attainment metrics – ensuring quantity and quality come together to meet business objectives

Funnel Progression Metrics

We can break funnel progression metrics into the following four sub-categories that provide insight into conversion quality:


  • New Leads
  • Sales Acceptance
  • Sales Readiness
  • Purchase Velocity

For each of these, we have a number of key metrics to consider.

New Leads

This first set of metrics is used to assess marketing effectiveness in terms of generating the right number and the right type of leads.

Marketing Qualified Lead Rate combines several stages in the funnel to incorporate a quality component into the marketing effectiveness assessment. This metric looks at the number of marketing qualified leads (MQLs) that are generated from all marketing contacts. This ratio improves as your marketing initiatives become more effective at generating more qualified leads, or more efficient at screening out low potential contacts.


Marketing Qualified Lead Rate = # of MQLs / # of total marketing contacts

Example – Direct marketing campaign promoting Webinar
10,000 contacts reached
800 Webinar participants
200 marketing qualified leads

Marketing Qualified Lead Rate = 200 / 10,000 = 2%

As an alternative, you can split the marketing qualified lead conversion metric into two metrics. This will provide more detail but the metrics must be used with caution, since improvements to the single metric may not align to improved business results. You will see that the two examples below match up to the example above.


Engagement Rate, in some cases referred to as a response rate, indicates how well Marketing generates some form of action from its targeted contacts. It is focused more on lead quantity than lead quality. Some marketing programs will generate fewer, high quality leads while others will attract a high response among lower quality of leads. This metric can be used to diagnose problem areas or compare how different marketing programs can be used in the marketing mix but is a low priority metric in terms of managing lead quality and goal attainment.

Engagement Rate = # of contacts taking action / # of marketing contacts

Example – Direct marketing campaign promoting Webinar
10,000 contacts reached
800 Webinar participants

Engagement Rate = 800 / 10,000 = 8%

Lead Qualification Rate is used with the engagement rate metric to determine how many of the “engaged” contacts qualify for Marketing to hand off to Sales. This screening step is not always included as a marketing responsibility, however, as we have noted in the first three articles of this series, it is a step that significantly impacts marketing profitability.

Lead Qualification Rate = # of marketing qualified leads (MQLs) / # of leads generated

Example – Webinar participants qualified via marketing screening process
800 Webinar participants
200 marketing qualified leads

Lead Qualification Rate = 200 / 800 = 25%

Sales Acceptance

Sales acceptance of marketing-generated leads is the next critical step in the process. If Sales is rejecting or even ignoring marketing leads, the marketing budget is not likely to be generating good ROI. The definitions for marketing qualified lead screening should align to the requirements for sales qualified leads (although not as strict).

Sales Acceptance Rate is one of the best indicators of lead quality, and could easily be labeled as the “Lead Quality” metric. It is the ratio of sales qualified leads to marketing qualified leads. It serves as an excellent indicator of how well Marketing is qualifying and screening leads to maintain high quality levels. A good target to aim for is 70% – 80% MQL to SQL.

Sales Acceptance Rate = # of Sales Qualified Leads (SQLs) / # of MQLs

Example – Marketing qualified leads from Webinar passed to Sales
200 MQLs passed to Sales
120 leads accepted as SQLs

Sales Acceptance Rate = 120 / 200 = 60%

Opportunity Rate tracks lead quality at a more precise level than the Sales Acceptance or Marketing Qualified Lead Rate metrics. Opportunities are typically defined by the Sales organization as leads that have clearly defined needs, purchasing authority, an expectation to purchase within a reasonable time period, and budget. This metric is assessing Marketing’s ability to generate leads that are generally ready to buy. It is based on the percent of leads generated converting to an opportunity.

Opportunity Rate = # of Opportunities / # of MQLs

Example – Marketing qualified leads passed to Sales and qualified as opportunities
200 MQLs passed to Sales
80 leads converting to Opportunities

Opportunity Rate = 80 / 200 = 40%

You can substitute number of leads generated in place of the number of MQLs passed to Sales if that works better for your organization.

Sales Pipeline Metrics


Too often, Marketing does not have system access to track their leads through the sales pipeline. As we have established in the first three articles of this series, Marketing must have insight into and contribute to influencing prospects at all stages of the purchase funnel. Marketing can have a significant role in creating “sales readiness,” especially in those firms making the argument to invest in branding to create stronger differentiation, and the best measures to understand the impact of those efforts are in the conversion rates within the sales funnel. The other significant benefit in tracking sales conversion rates is to understand sales effectiveness and where additional marketing support can improve the net sales rate (remember from Part 1 that improving conversion rates late in the purchase funnel has high ROI potential).

Opportunity to Close Rate summarizes the overall sales pipeline performance from the point of identifying a viable buyer to winning the sale. This can be further split into conversion rates for each major stage in the pipeline (such as opportunity to meeting, meeting to proposal, proposal to close) to provide more detail, but these two points work fairly well in representing the area that Sales manages. This detail is extremely valuable in diagnosing weak areas in the sales cycle.

Opportunity to Close Rate = # of Closed Sales / # of Opportunities

Lead to Close Rate (or Lead to Purchase Rate) captures the net outcome of the leads generated. This assesses how many leads passed to sales (MQLs) convert into sales.

Lead to Close Rate = # of Closed Sales / # of MQLs

Sales Capacity (or # of Leads per Rep) is also a good indicator of sales performance. This is the number of active leads managed divided by the number of sales people managing those leads. There is a point where the number of active leads begins to hurt sales effectiveness and this metric should show when that point is reached.

Sales Capacity = # of Active Leads / # Sales Reps

Purchase Velocity

Monitoring the pace of leads moving through the sales cycle provides additional insight that is often missed. There are two high priority metrics in this category.

Lead Contact Velocity is the average number of days between leads being handed off to Sales and Sales making initial contact (or contact attempts). It is an excellent indicator of sales capacity and can help in understanding why lead quality might mistakenly be viewed as declining. We had a client who could not determine why fewer and fewer leads were converting to opportunities, only to discover that the average days for the first contact had changed from 3 days to 14 days.

Lead Contact Velocity = Average # of Days from lead passed to lead contact

Lead to Close Velocity, also referred to as the sales cycle time, is the average number of days between a lead being handed off to Sales, and the closed sale date. As the sales cycle duration increases, it increases the cost to the sales organization, increases the number of active leads that need to be managed, and typically means a lower sales conversion rate. This metric lets the marketing organization know if additional effort needs to be put against sales readiness, or if additional tactics are necessary within the sales pipeline.

Lead to Close Velocity = Average # of Days from lead passed to closed sale

Customer Value Metrics

In addition to conversion rates, the other component of lead quality is customer value. By “value,” we are referring to the incremental profits generated from new customers and/or new sales. While revenue and sales volume are important, we must get to profits if we are going to assess ROI and ensure that our marketing programs generated more than we spent.


Customer value metrics help the marketing organization 1) improve targeting, 2) improve effectiveness in attracting higher value leads, and 3) improve customer purchase decisions to buy more or buy higher value products and services.

Average Profit per Customer should consist of the net present value of incremental customer profits generated as a result of this campaign. It encompasses the current purchase and the repeat purchases likely to follow (without additional investment in up-selling and cross-selling). This metric could easily be modified to alternatives such as Average Profit per Sale (if buyers are not known or tracked), or Average Profit per First Time Buyer.


Average Profit per Customer = total incremental profits / # of customers buying

Other metrics that reflect specific portions of customer value include Retention Rate (or Repeat Purchase Rate), Average Profit per Order, and Average Orders per Year (or any other time period).

Cost Management Metrics

You want to be careful with cost metrics since any positive changes to conversion rates or customer value can easily justify increased costs. However, you do want to look for opportunities to generate the same lead quality with less expense.


The three cost management metrics that each show a slightly different perspective are
Cost per MQL, Cost per Opportunity, and Cost per Sale.

Cost per MQL (or Cost per Lead if you do not have a qualification stage) provides a very narrow, marketing-only perspective that ends with the marketing leads. It is okay but not ideal.

Cost per MQL = Total Marketing Cost / # of MQLs generated

Cost per Opportunity is probably the best metric for lead generation marketing since it sets the objective that leads should be screened and nurtured properly and ready for the sales cycle.

Cost per Opportunity = Total Marketing Cost / # of Opportunities from MQLs

Cost per Sale is another excellent metric which provides an integrated Marketing and Sales perspective. This includes both the marketing and sales expense so it motivates Marketing to provide fewer, better leads.

Cost per Sale = Total Marketing & Sales Cost for a set of leads / # of closes sales from the same set of leads

Goal Attainment Metrics

All of the metrics so far provide insight into your effectiveness and lead quality, but it is possible to improve quality and then not have enough leads to reach your goals. This last set of metrics helps ensure that you (Marketing and Sales together) are on track to meet the financial objectives of the company.

Number of Active Leads per Period lets the marketing organization know if there are enough leads to reach the sales goals for upcoming periods. This metric can indicate a sales capacity issue when too high, letting Marketing know to reduce new leads. You could use the metric Lead Volume per Period, which represents the total number of new leads that Marketing delivers to Sales, but that does not take into consideration sales capacity and does not ensure there are enough leads in the pipeline to generate the right number of sales.


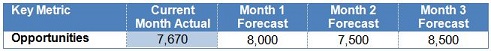
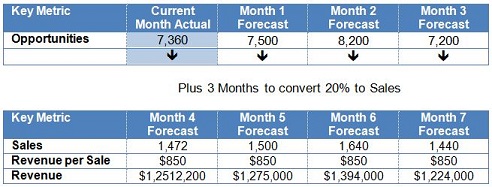
Number of Active Opportunities per Period is an alternate version that will be more predictive of future sales volumes. For either metrics, the sales organization should know how many active leads or opportunities are necessary to meet closed sales goals. This is determined by using your target number of closed sales and your conversion rate. For example, if your Opportunity to Close Rate is 10% and your target sales for each month is 20, then at any given time, the sales organization needs to have 200 active opportunities. This is calculated by dividing the sales goal by the conversion rate (20 / 10% = 200). The time period is not relevant as long as the Lead to Close Velocity remains steady.


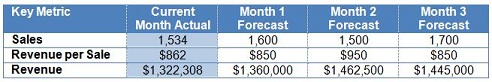
Projected Profit per Active Opportunity is the ideal metric to monitor the financial value of the pipeline. It is used in conjunction with the Number of Active Opportunities per Period and the Opportunity to Close Rate to forecast the future flow of profits from new sales. Realistically, this is more often tracked as projected revenue per opportunity. While revenue does not show the true relative value of different opportunities, it tends to fit the sales management process well.


Total Sales Volume per Period is an important outcome metric that is used with the Average Profit per Customer to manage the financial performance from new sales.

Metrics Selection

We’ve covered a good set of metrics in several categories to monitor and manage overall lead generation performance. These metrics extend into the sales pipeline, which is required to truly manage the marketing impact on business outcomes, so work must be done to set up access and tracking.


Your primary metrics should be as comprehensive as possible in covering lead quality (conversion rates and customer value), cost management, and goal attainment (lead quantity). Each marketing organization will have a unique set of metrics. Your final set of metrics will be determined by:


  • The availability of the right data to track lead outcomes, including the sales pipeline
  • The quality of tracking data since you need to avoid using data that will report inaccurate metrics
  • The customer relationship, since the detail of tracking data is dependent on your ability to know progression through the funnel stages
  • Your decision process, since your dashboard and metrics should be defined based on how the marketing organization makes decisions to manage their performance.

This concludes our 4-part series on Lead Generation ROI. There is clearly a significant opportunity to improve the ROI of lead generation marketing with better measurement and management processes. Whether it is better alignment with sales, better metrics, or leveraging new insights to guide marketing strategies and tactical decisions, every step forward will result in improved marketing performance and profitability.


Return to Part 1: Lead Quality Counts >>

Categories
Article Library rio resources

Leveraging Marketing Automation for Better Measurements

Lenskold Article Series

by Jim Lenskold

Leveraging Marketing Automation for Better Measurements

More and more marketing organizations are adopting marketing automation for campaign management, lead management, and the emerging area of revenue performance management. Marketing automation not only improves efficiency, it drives increased marketing effectiveness through better targeting, content management, nurturing, scoring and closed-loop tracking. Most systems have very good reporting but that is only the start for generating more robust measurements with this new source of marketing data and customer behaviors.

Companies that have implemented or are planning to implement marketing automation should understand how these systems support and enable better measurements. There are opportunities to generate better insights into marketing’s contribution to incremental sales, revenue, and profits. I’ll share with you the limitations current systems have in terms of measurement capabilities as well as tips to gain more insights from the tracking capabilities and rich data within these systems to guide marketing decisions towards higher ROI.

Keep in mind that our primary goal for marketing measurements is to guide strategic and tactical decisions so the next dollar spent on marketing is more profitable than the last. Our requirements are different than simple results reporting. We need actionable insight on strategies in addition to comparisons of tactic performance.


Awareness is the first stage in the customer purchase funnel since a potential buyer must be aware of your product or service before evaluating and consciously choosing to purchase your brand. Measurements of the early stages of the customer purchase funnel are dependent on surveys of perceptions such as awareness, consideration, preference and/or purchase intention. This is where the definition of brand awareness becomes incredibly important. If you are making the case that brand awareness has value, you must be able to articulate to executives the exact definition and the strategy for how you expect this will drive a financial contribution for the company.

We’ll cover the following three categories of measurement improvements related to marketing automation:


Better management of basic measures
Modeling & analytics measures using captured data
Key metrics and performance management

This information is not intended to provide a comparison of technologies but instead to provide guidance for improving measurement capabilities using marketing automation technologies such as Aprimo, Unica, Marketo and Eloqua.


Better Management of Basic Measures

Many marketing automation systems have basic measurement capabilities built in to provide detailed results tracking and support for market testing. Current automation solutions are generally managing and measuring direct marketing and online marketing campaigns that track responses, leads, and sales to a specific tactic. Historically, direct response marketing has been well-measured so the new benefits come from campaign reporting that is delivered faster, with less effort and with more detail.


Results tracking measures allow marketers to compare the impact of individual tactics on outcomes such as leads, sales, revenue and profit. While an important measurement tactic, results tracking is a basic measurement approach that does account other marketing and non-marketing factors influencing those outcomes; yet it offers plenty of insight. This measurement approach allows for comparisons to identify higher performing tactics and weaker tactics that need to be improved or eliminated. Results measurements can provide a good indication of relative ROI when comparing the financial contribution against the cost for each tactic.

Recommendations to get the most from results tracking measurement processes follow:

Track or project results through to sales conversion and average profit per sale for a more accurate comparison than responses alone
Analyze results at a segment level to identify where performance meets objectives and to guide future targeting
Supplement tracking with more robust modeling and analytics when insight is needed into the impact of multiple touch points

The second capability is marketing automation’s support for using market testing measures. This support involves creating matching treatment and control groups and generating results for direct marketing campaigns. The control group excludes a specific direct marketing tactic to measure the true incremental lift of that specific tactic. Market testing to comparable treatment and control groups will eliminate the influence of other marketing and non-marketing factors, providing a more reliable measurement than basic results tracking. Market testing can also be set up for assessing online media campaigns or online content using A/B splits. This approach is primarily used to test a “challenger” campaign against a “champion” campaign to assess the relative impact and requires a comparable control group to measure the incremental lift of the specific campaign within the broader marketing mix.

Actions to improve market testing measurements:

Set up market test measures to assess and identify higher-performing strategies; don’t be limited to only measures comparing tactics
Expand current measures beyond single tactics to assess contact strategies, contact frequency, or the integration of multiple tactics over time
Experiment with alternative strategies and tactics to accelerate improvements in effectiveness

Rich Data for Advanced Modeling & Analytics

A significant gap that creates a major measurement barrier for many companies is access to detailed marketing data. Marketing automation greatly reduces this barrier by serving as a repository for a good portion of marketing activity and responses. Marketing automation systems capture data on the marketing initiatives that are planned and executed through those systems, which tend to consist of direct response programs and online campaigns. These systems are also starting to capture social media activity, which enables better measurement of these emerging marketing channels.


When this data is combined with data for missing mass media marketing and offline marketing programs, modeling can be run to assess the marketing mix and identify performance drivers. Sophisticated modeling measurements can identify the sales contribution of each tactic within the overall marketing mix, eliminating the attribution of each sale to a single tactic that is used in results tracking.


Even without the addition of non-tracked marketing, there is plenty of rich data to support analytics assessing marketing performance. Modeling of tracked campaign data can include:

Lead Quality Analysis – Predictive modeling is used to project sales conversion rates and average customer value to assess the effectiveness of specific tactics to attract higher value and higher potential prospects. Measuring lead quality will lead to decisions that drive better marketing performance compared to relying only on lead quantity.
Multi-Touch Drivers & Synergies – Modeling to assess the relative contribution of tracked marketing campaigns on generating leads, opportunities or sales within a complex mix of multiple touch points. This analysis uncovers hidden marketing drivers that get missed when results are tracked to the first lead source or last contact. With this analysis, the incremental contribution of these tactics that would otherwise be missed can now be quantified.
Engagement Lift – Analytics are run on specific forms of buyer engagement such as educational programs or social media contacts to determine the incremental lift on sales outcomes. This analysis quantifying the impact of a non-purchase action helps marketers assess marketing initiatives aimed at motivating such forms of engagement.

Actions for better model measurements:

Capture weekly data on marketing activity and response for more precise modeling
Aggregate marketing data not managed through marketing automation for more complete modeling
Run modeling to eliminate the complexity of multi-touch marketing environments to better understand the effectiveness of current tactics
Use analytics with available data for deeper insights into specific aspects of marketing performance

Key Metrics & Performance Management

Marketing automation systems provide dashboards and other reporting capabilities to help track key metrics. Metrics can be tracked back to specific marketing initiatives or rolled up into a collective view. This functionality is a huge step forward in managing marketing performance and effectiveness. There are many valuable metrics and we’ll summarize what’s most important for guide marketing decisions and maximize ROI.

Recommendations to gain better insight from key metrics reporting:

Choose metrics that align well to ROI. Start with the primary drives of ROI, which include sales conversion rates (sales as percent of responses, leads, or opportunities), average profit per sale and average cost per sale.
Monitor purchase funnel progression metrics and analyze leakage points to determine where marketing improvement is needed to better influence purchase decisions.
Metric trends tell much more than the current value of a metric so monitor changes over time.
Use forecasting where possible to understand how changes in metrics today will influence financial outcomes in the periods that follow.

Innovation in marketing automation is moving at a very good pace. Marketers benefit from capabilities to better design and manage campaigns, as well as deriving better insights into marketing performance. Automation enables enhanced measurements and analytics so marketers can manage and improve effectiveness. Technologies will continue to capture more of the data that is so critical for advanced analytics to address the complex questions of marketing contribution. Marketers that use marketing automation as a resource for managing, measuring, and improving marketing effectiveness will certainly gain great advantages in achieving their goals.


Categories
Article Library rio resources

3 Steps to Successfully Forecast Marketing Metrics

Lenskold Article Series

by Jim Lenskold

3 Steps to Successfully Forecast Marketing Metrics

Performance-driven marketers will have a good set of metrics to track, report and manage their effectiveness. But marketers that want to ensure marketing is highly relevant as a key business driver will also forecast their metrics. A forecast of key metrics provides business executives with insight into likely financial outcomes so they can manage business decisions and expectations. Proactively managing forecasts to consistently deliver on objectives builds great credibility for marketing.


Forecast metrics must align to business outcomes such as sales and revenue. These may be metrics such as the quantity of new leads or opportunities for B2B marketers. For B2C marketers, it may be new first-time buyers or customer retention. Each marketing organization must identify the forecast metrics most relevant to their own business and make sure to project and report these metrics to drive marketing effectiveness.


There are three key steps to establish or improve your forecasting metrics. Success is determined by knowing which metrics to select, which approach to use for forecasting, and how to use those metrics in managing performance.

1. Choose Meaningful and Predictable Metrics

Forecasting metrics are part of a monthly business process intended to keep the management team informed of expected outcomes in upcoming months. In some businesses, marketing has enough data to forecast revenue or project sales volumes that can be converted to revenue with either an estimate or separate forecast for the average revenue per sale.

Example of a Sales & Revenue Forecast

The sales and revenue forecast delivers what management needs to compare projections to objectives and plan accordingly. Projecting the average revenue per sale is particularly useful when marketing can influence this metric through strategies such as targeting.


More often, marketers will need to forecast metrics that are good indicators of sales and revenue. Take for example marketers that forecast sales opportunities (leads that are determined by a sales team to have good sales potential). This is a metric marketing may be able manage to as an outcome more easily than closed sales that must occur over a long sales cycle.


Example of Marketing’s Sales Opportunity Forecast

When forecasting sales opportunities or other “funnel” metrics that occur prior to a sale, the management team must apply this forecast to project sales and revenue. In a simplified example, if sales opportunities historically have shown that 20% will convert to a sale 3 months after becoming an opportunity, the sales projection would be as follows:


Example of using Sales Opportunity Forecast for Sales & Revenue Forecast

Keep in mind that if you are projecting a metric that comes earlier in the purchase cycle, such as web traffic or customer engagement, the ability to predict sales volumes over time could be more challenging but may be possible with good data and analytics.


Here are some guidelines for choosing your forecast metrics. The right metrics for forecasting:


  • Are most closely aligned to sales and/or revenue
  • Have consistent influence on financial outcomes over time
  • Are reasonably predictable with the data available
  • Have clear definitions and meaning to all stakeholders
  • Are within marketing’s ability to impact and manage

2. Establish Your Approach for Accurate Forecasting

In most situations, accuracy is the goal for forecasting, which may differ from a common practice of “low-balling” estimates in order to consistently exceed goals. When managing performance, low projections should trigger corrective actions. Therefore, under-estimating forecasts could lead to marketing adjustments that are unnecessary and ultimately hurt the credibility of the marketing organization.


Deciding on the approach to forecast key metrics will be based on 1) the data available, 2) the analytic skills available and 3) the precision required. The data used can include marketing activities (e.g., advertising levels, direct marketing contacts, events), customer actions (e.g., responses, engagement, leads or opportunities), product info (e.g., pricing, offers, new product launches) and/or external influences (market trends or competitive activity).


There are three general types of approaches to consider that range in sophistication from basic to more advanced.


  • Project using historical conversion rates
  • Use predictive scoring
  • Develop forecasting models

Following is a summary of each approach.

Historical Conversion Rates Approach

A very basic approach to forecasting is to apply historical rates of conversions between tracked metrics and sales or financial outcomes. This works very well when tracking a marketing outcome that comes shortly before a purchase decision, such as Sales Opportunities as shown in the example above. The approach works similarly for other metrics such as product trials or website landing page visits as long as the conversion rates are fairly consistent over time.

Predictive Scoring

For marketers that engage directly with prospects and customers to generate leads and sales, predictive scoring is an approach that can improve forecast accuracy. This approach uses contact-specific data, such as profiles or purchase history, to project the probability of converting to a sale and/or the expected value per sale. Predictive modeling is used to analyze prior contacts converting to sales in order to identify the characteristics and value of buyers. The probabilities are applied to score new leads or potential buyers and project upcoming sales volumes.

As a basic example, if contacts from region A tend to convert at a higher rate than region B and recent marketing has generated a higher portion of leads from region A, the predictive scoring would use this (and many other data points) to show a higher projected conversion rate.

Forecast Modeling Approach

Advanced statistical techniques can be used to develop forecasting models that are very predictive of sales and/or revenue outcomes. These models are created using many data points that include detailed marketing activity, changes in market conditions, product and pricing changes, and competitive activity. Once the model is developed, actual data is input along with upcoming planned assumptions to project the outcomes. Forecasting models can take many variables into consideration and generate fairly accurate projections, so this approach is often preferred for quality forecasts over longer periods of time.

Keep in mind that the number of periods to report should be determined by the needs of the business and the predictive accuracy of your metrics (which is dependent on your approach). As a starting point, if your metrics are not very accurate over a three month period, you need to find different metrics, change your forecasting approach, or shorten the forecast period.

3. Report and Use Forecast Metrics

When reporting your forecast metrics, it is important to have a process to understand, assess and act on the information to manage performance. The reports should show comparisons of the forecast vs. goals and the forecast vs. actual outcomes. The process will outline how to diagnose the gaps and take corrective actions as outlined below.

Forecast vs. Goal

The forecast metrics each need a comparison to some goal to indicate whether that forecast is on track or above/below a specific target. When the forecast is below the goal, it alerts the marketing team to take corrective actions to improve results, which is a primary purpose of forecasting. Over time, the business needs and experience will shape the process for when alerts should trigger actions.

Actual vs. Forecast

Each period, the forecast is updated and the most recent period is replaced with actual results. Standard practice seems to be to discard the previous forecast as it is replaced with a more current version. But there is significant value in comparing actuals to prior forecasts to 1) improve your forecasting accuracy and 2) provide full disclosure of your forecast changes to stakeholders.

When Jon Miller was VP of Marketing for Marketo, he shared a great example of how he maintained his forecast history. Jon’s presentation to his executives included his prior forecasts along with his latest forecast as shown in the diagram below. Stakeholders could look back to see how the forecast had been revised monthly and also look forward to see the most current view of expected outcomes.

Diagnostics and Course Correction

Metrics are used to communicate the status and course of business performance and alert the business as to when performance is off track. Once you establish and begin reporting on metrics you must be prepared to diagnose and explain deviations from your goals and prior forecasts. The first step should be to check on a broader set of metrics to identify underlying problem areas. Drill down analyses and research may be necessary to explain the cause which may be driven by changes to the marketing strategy, changes in effectiveness, new competitive actions or shifting market trends.   Choosing metrics to forecast, establishing your approach and defining the process to report and use forecast metrics will enable you to add forecasting for key metrics to your dashboard. Here are some additional guidelines to creating effective dashboards:  
  • Get the right information to the right stakeholders – Provide executives with high level business outcome metrics, while providing their direct reports with the metrics they need to manage to influence those business outcomes.
  •  
  • Provide few meaningful metrics – Too many metrics will be more distracting than valuable so prioritize to maintain focus.
  •  
  • Ensure consistent interpretation –All recipients of the report should know if the metrics reported are to be viewed as positive, negative or neutral.
  •  
  • Quantify the impact of deviations – Provide a context to compare the gaps across metrics since a 10% shortfall for one metric may have a completely different impact on the business than a 10% shortfall on another metric. When metrics vary from the target, calculate the impact on the business in current and future periods.
  •  
  • Be prepared with an action plan – Before your forecast metrics are reported and show a shortfall, 1) establish the process to diagnose the underlying drivers and 2) have an action plan ready with strategies and tactics that are best suited to improve the outcome of specific metrics.
Marketers that forecast metrics, either for executive management or their own use, are better positioned to manage and deliver on business results. Reporting only on current performance metrics will tell you what has happened but offer no opportunity to change those outcomes. The extra effort of forecasting metrics gives you the best estimate of future results at a time when you can still influence outcomes. Forecast metrics are a key step in moving from a reporting dashboard to a performance management dashboard that helps to improve marketing effectiveness.