

Lenskold Article Series
by Jim Lenskold
3 Steps to Successfully Forecast Marketing Metrics
Performance-driven marketers will have a good set of metrics to track, report and manage their effectiveness. But marketers that want to ensure marketing is highly relevant as a key business driver will also forecast their metrics. A forecast of key metrics provides business executives with insight into likely financial outcomes so they can manage business decisions and expectations. Proactively managing forecasts to consistently deliver on objectives builds great credibility for marketing.
Forecast metrics must align to business outcomes such as sales and revenue. These may be metrics such as the quantity of new leads or opportunities for B2B marketers. For B2C marketers, it may be new first-time buyers or customer retention. Each marketing organization must identify the forecast metrics most relevant to their own business and make sure to project and report these metrics to drive marketing effectiveness.
There are three key steps to establish or improve your forecasting metrics. Success is determined by knowing which metrics to select, which approach to use for forecasting, and how to use those metrics in managing performance.
1. Choose Meaningful and Predictable Metrics
Forecasting metrics are part of a monthly business process intended to keep the management team informed of expected outcomes in upcoming months. In some businesses, marketing has enough data to forecast revenue or project sales volumes that can be converted to revenue with either an estimate or separate forecast for the average revenue per sale.
Example of a Sales & Revenue Forecast
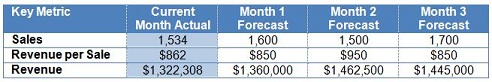
The sales and revenue forecast delivers what management needs to compare projections to objectives and plan accordingly. Projecting the average revenue per sale is particularly useful when marketing can influence this metric through strategies such as targeting.
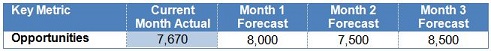
More often, marketers will need to forecast metrics that are good indicators of sales and revenue. Take for example marketers that forecast sales opportunities (leads that are determined by a sales team to have good sales potential). This is a metric marketing may be able manage to as an outcome more easily than closed sales that must occur over a long sales cycle.
Example of Marketing’s Sales Opportunity Forecast
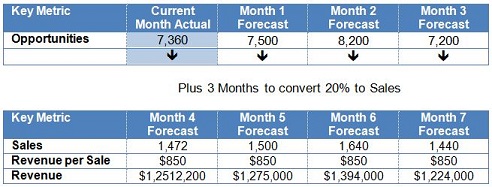
When forecasting sales opportunities or other “funnel” metrics that occur prior to a sale, the management team must apply this forecast to project sales and revenue. In a simplified example, if sales opportunities historically have shown that 20% will convert to a sale 3 months after becoming an opportunity, the sales projection would be as follows:
Example of using Sales Opportunity Forecast for Sales & Revenue Forecast
Keep in mind that if you are projecting a metric that comes earlier in the purchase cycle, such as web traffic or customer engagement, the ability to predict sales volumes over time could be more challenging but may be possible with good data and analytics.
Here are some guidelines for choosing your forecast metrics. The right metrics for forecasting:
- Are most closely aligned to sales and/or revenue
- Have consistent influence on financial outcomes over time
- Are reasonably predictable with the data available
- Have clear definitions and meaning to all stakeholders
- Are within marketing’s ability to impact and manage
2. Establish Your Approach for Accurate Forecasting
In most situations, accuracy is the goal for forecasting, which may differ from a common practice of “low-balling” estimates in order to consistently exceed goals. When managing performance, low projections should trigger corrective actions. Therefore, under-estimating forecasts could lead to marketing adjustments that are unnecessary and ultimately hurt the credibility of the marketing organization.
Deciding on the approach to forecast key metrics will be based on 1) the data available, 2) the analytic skills available and 3) the precision required. The data used can include marketing activities (e.g., advertising levels, direct marketing contacts, events), customer actions (e.g., responses, engagement, leads or opportunities), product info (e.g., pricing, offers, new product launches) and/or external influences (market trends or competitive activity).
There are three general types of approaches to consider that range in sophistication from basic to more advanced.
- Project using historical conversion rates
- Use predictive scoring
- Develop forecasting models
Following is a summary of each approach.
Historical Conversion Rates Approach
A very basic approach to forecasting is to apply historical rates of conversions between tracked metrics and sales or financial outcomes. This works very well when tracking a marketing outcome that comes shortly before a purchase decision, such as Sales Opportunities as shown in the example above. The approach works similarly for other metrics such as product trials or website landing page visits as long as the conversion rates are fairly consistent over time.
Predictive Scoring
For marketers that engage directly with prospects and customers to generate leads and sales, predictive scoring is an approach that can improve forecast accuracy. This approach uses contact-specific data, such as profiles or purchase history, to project the probability of converting to a sale and/or the expected value per sale. Predictive modeling is used to analyze prior contacts converting to sales in order to identify the characteristics and value of buyers. The probabilities are applied to score new leads or potential buyers and project upcoming sales volumes.
As a basic example, if contacts from region A tend to convert at a higher rate than region B and recent marketing has generated a higher portion of leads from region A, the predictive scoring would use this (and many other data points) to show a higher projected conversion rate.
Forecast Modeling Approach
Advanced statistical techniques can be used to develop forecasting models that are very predictive of sales and/or revenue outcomes. These models are created using many data points that include detailed marketing activity, changes in market conditions, product and pricing changes, and competitive activity. Once the model is developed, actual data is input along with upcoming planned assumptions to project the outcomes. Forecasting models can take many variables into consideration and generate fairly accurate projections, so this approach is often preferred for quality forecasts over longer periods of time.
Keep in mind that the number of periods to report should be determined by the needs of the business and the predictive accuracy of your metrics (which is dependent on your approach). As a starting point, if your metrics are not very accurate over a three month period, you need to find different metrics, change your forecasting approach, or shorten the forecast period.
3. Report and Use Forecast Metrics
When reporting your forecast metrics, it is important to have a process to understand, assess and act on the information to manage performance. The reports should show comparisons of the forecast vs. goals and the forecast vs. actual outcomes. The process will outline how to diagnose the gaps and take corrective actions as outlined below.
Forecast vs. Goal
The forecast metrics each need a comparison to some goal to indicate whether that forecast is on track or above/below a specific target. When the forecast is below the goal, it alerts the marketing team to take corrective actions to improve results, which is a primary purpose of forecasting. Over time, the business needs and experience will shape the process for when alerts should trigger actions.
Actual vs. Forecast
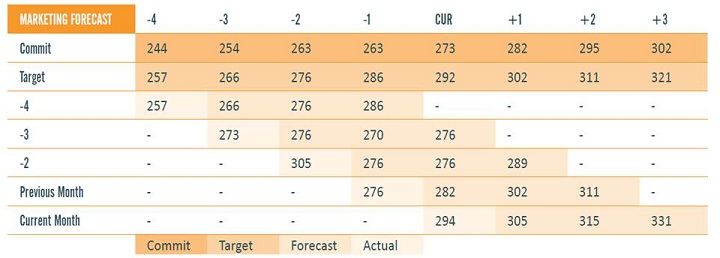
Each period, the forecast is updated and the most recent period is replaced with actual results. Standard practice seems to be to discard the previous forecast as it is replaced with a more current version. But there is significant value in comparing actuals to prior forecasts to 1) improve your forecasting accuracy and 2) provide full disclosure of your forecast changes to stakeholders.
When Jon Miller was VP of Marketing for Marketo, he shared a great example of how he maintained his forecast history. Jon’s presentation to his executives included his prior forecasts along with his latest forecast as shown in the diagram below. Stakeholders could look back to see how the forecast had been revised monthly and also look forward to see the most current view of expected outcomes.
Diagnostics and Course Correction
Metrics are used to communicate the status and course of business performance and alert the business as to when performance is off track. Once you establish and begin reporting on metrics you must be prepared to diagnose and explain deviations from your goals and prior forecasts. The first step should be to check on a broader set of metrics to identify underlying problem areas. Drill down analyses and research may be necessary to explain the cause which may be driven by changes to the marketing strategy, changes in effectiveness, new competitive actions or shifting market trends. Choosing metrics to forecast, establishing your approach and defining the process to report and use forecast metrics will enable you to add forecasting for key metrics to your dashboard. Here are some additional guidelines to creating effective dashboards:- Get the right information to the right stakeholders – Provide executives with high level business outcome metrics, while providing their direct reports with the metrics they need to manage to influence those business outcomes.
- Provide few meaningful metrics – Too many metrics will be more distracting than valuable so prioritize to maintain focus.
- Ensure consistent interpretation –All recipients of the report should know if the metrics reported are to be viewed as positive, negative or neutral.
- Quantify the impact of deviations – Provide a context to compare the gaps across metrics since a 10% shortfall for one metric may have a completely different impact on the business than a 10% shortfall on another metric. When metrics vary from the target, calculate the impact on the business in current and future periods.
- Be prepared with an action plan – Before your forecast metrics are reported and show a shortfall, 1) establish the process to diagnose the underlying drivers and 2) have an action plan ready with strategies and tactics that are best suited to improve the outcome of specific metrics.